Fig. 12
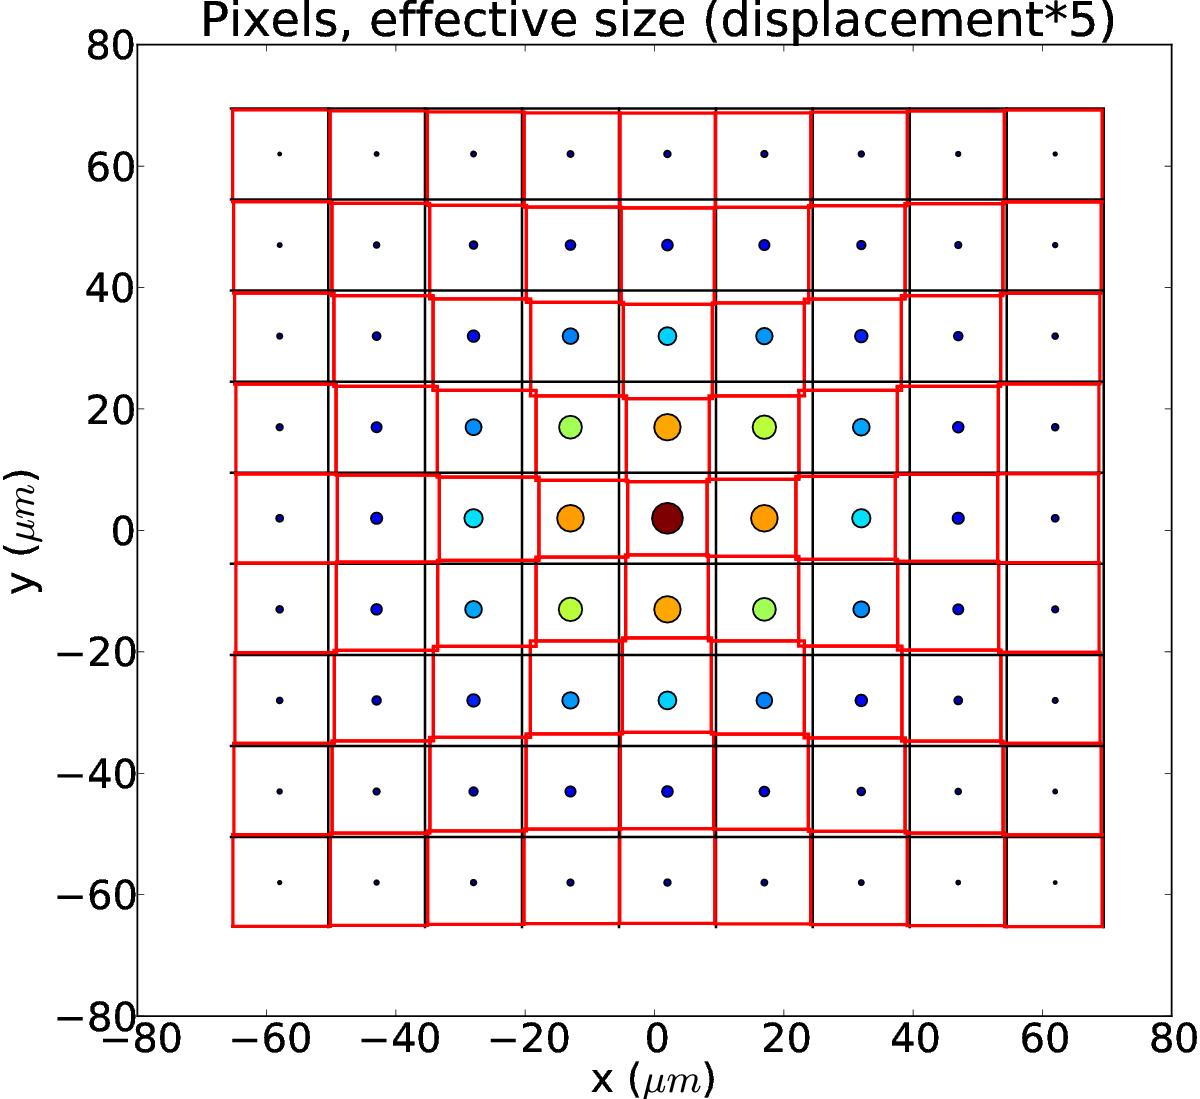
Illumination with a spot having 100 ke− in pixel maximum and a Gaussian shape with a rms of 1.6 pixel results in boundary displacements (multiplied by a factor 5, red lines) that depend on the distribution of charges within surrounding pixels (colored circles). The displacements between the intial boundaries (black) and their final positions (red) correspond to the δX terms of our model. It shows that the central pixel effective size shrinks as illumination increases, while pixels away from spot center tend to grow.
Current usage metrics show cumulative count of Article Views (full-text article views including HTML views, PDF and ePub downloads, according to the available data) and Abstracts Views on Vision4Press platform.
Data correspond to usage on the plateform after 2015. The current usage metrics is available 48-96 hours after online publication and is updated daily on week days.
Initial download of the metrics may take a while.