Fig. 1
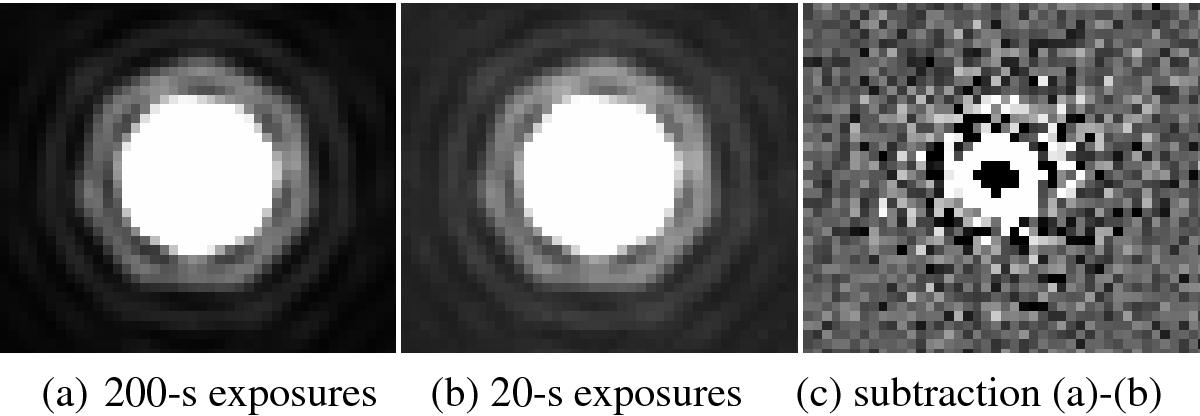
Direct shape comparison of bright and faint spots from the CCD E2V-250. The leftmost image is the average of 200 s exposures; and the middle one averages 20 s exposures; the rightmost image is the difference after proper scaling of 200 s spot image minus 20 s spot images. The broader wings and lower peak of the bright spot clearly show up. Since the images required a small alignment prior to subtraction, we have shifted both averages by half their separation, so that resampling affects both in the same way.
Current usage metrics show cumulative count of Article Views (full-text article views including HTML views, PDF and ePub downloads, according to the available data) and Abstracts Views on Vision4Press platform.
Data correspond to usage on the plateform after 2015. The current usage metrics is available 48-96 hours after online publication and is updated daily on week days.
Initial download of the metrics may take a while.