Fig. 6
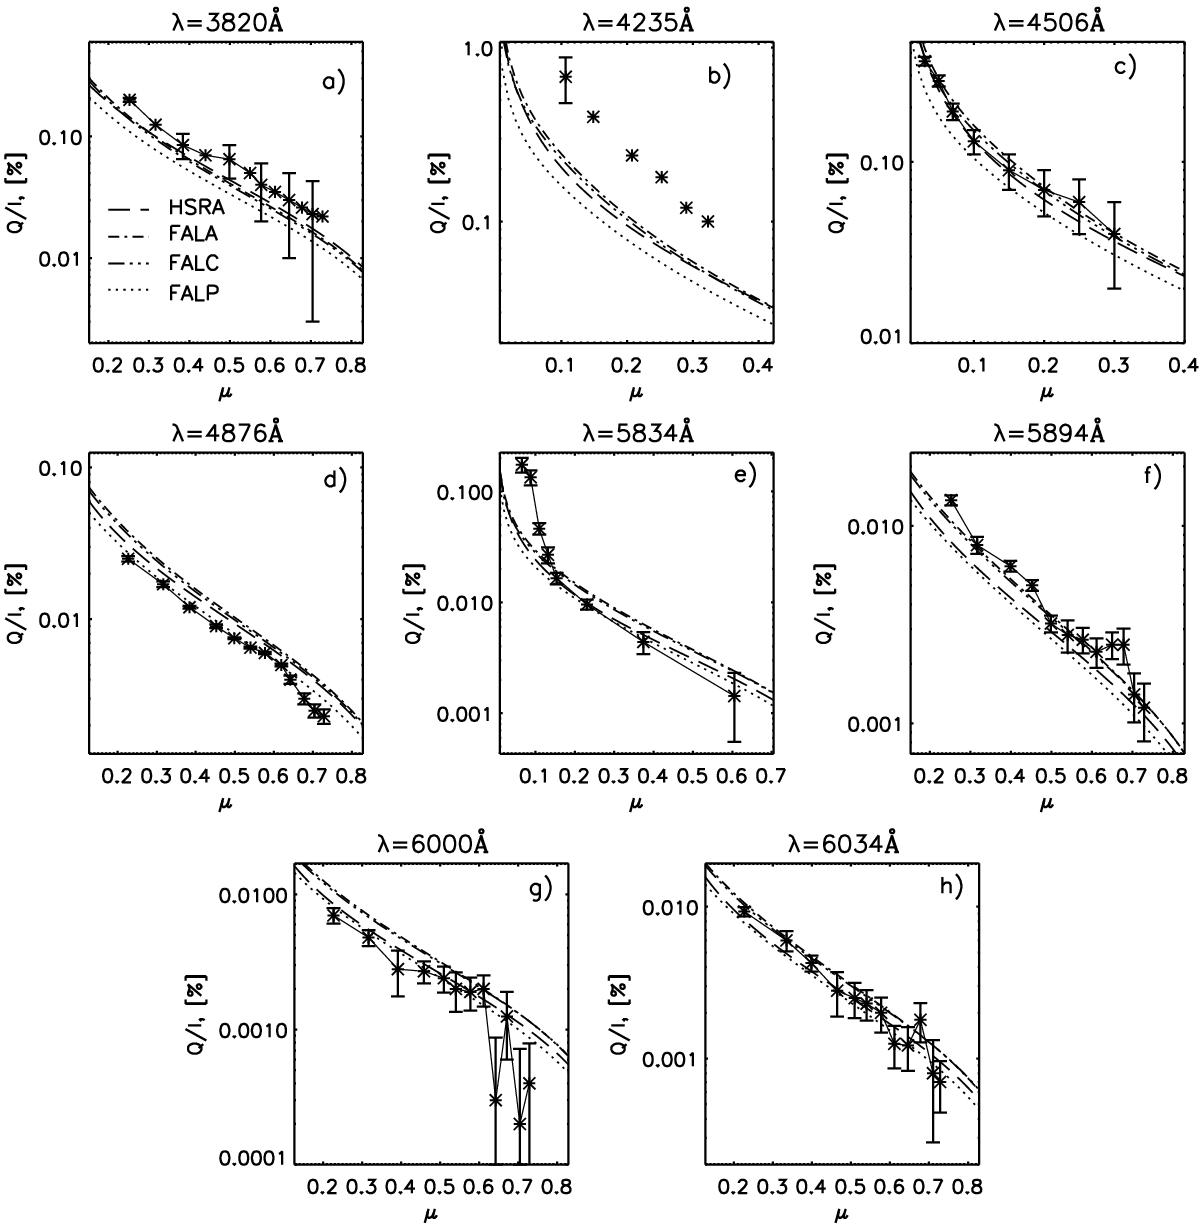
A comparison of modeled and observed center-to-limb variation of linear polarization. Different kind of lines depict our calculations for different model atmospheres: FALC, FALP, FALA, HSRA labeled in plot a). Symbols in a), d), f), g), h) show the solar disk polarization measured by Leroy (1972), in c) by Wiehr & Bianda (2003), in b) by Wiehr (1975), and in e) by Mickey & Orrall (1974). The wavelength at which the measurement was taken is given in each plot individually.
Current usage metrics show cumulative count of Article Views (full-text article views including HTML views, PDF and ePub downloads, according to the available data) and Abstracts Views on Vision4Press platform.
Data correspond to usage on the plateform after 2015. The current usage metrics is available 48-96 hours after online publication and is updated daily on week days.
Initial download of the metrics may take a while.