Fig. 5
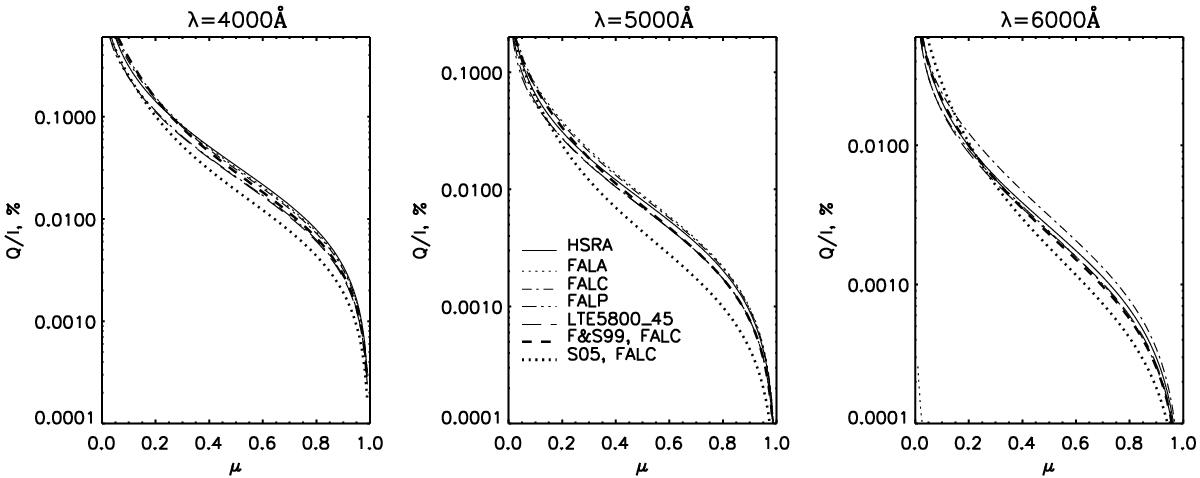
Center-to-limb variation of linear polarization. Different kind of lines depict our calculations for different model atmospheres: FALC, FALP, FALA, HSRA, and LTE5800-45 (Phoenix model for Teff = 5800 K and log g = 4.5). The thick dashed line (F&S99, FALC) corresponds to the analytical function for the FALC model taken from Fluri & Stenflo (1999), while the thick dotted line (S05, FALC) represents the analytical function taken from Stenflo (2005).
Current usage metrics show cumulative count of Article Views (full-text article views including HTML views, PDF and ePub downloads, according to the available data) and Abstracts Views on Vision4Press platform.
Data correspond to usage on the plateform after 2015. The current usage metrics is available 48-96 hours after online publication and is updated daily on week days.
Initial download of the metrics may take a while.