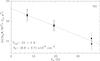
Fig. 9
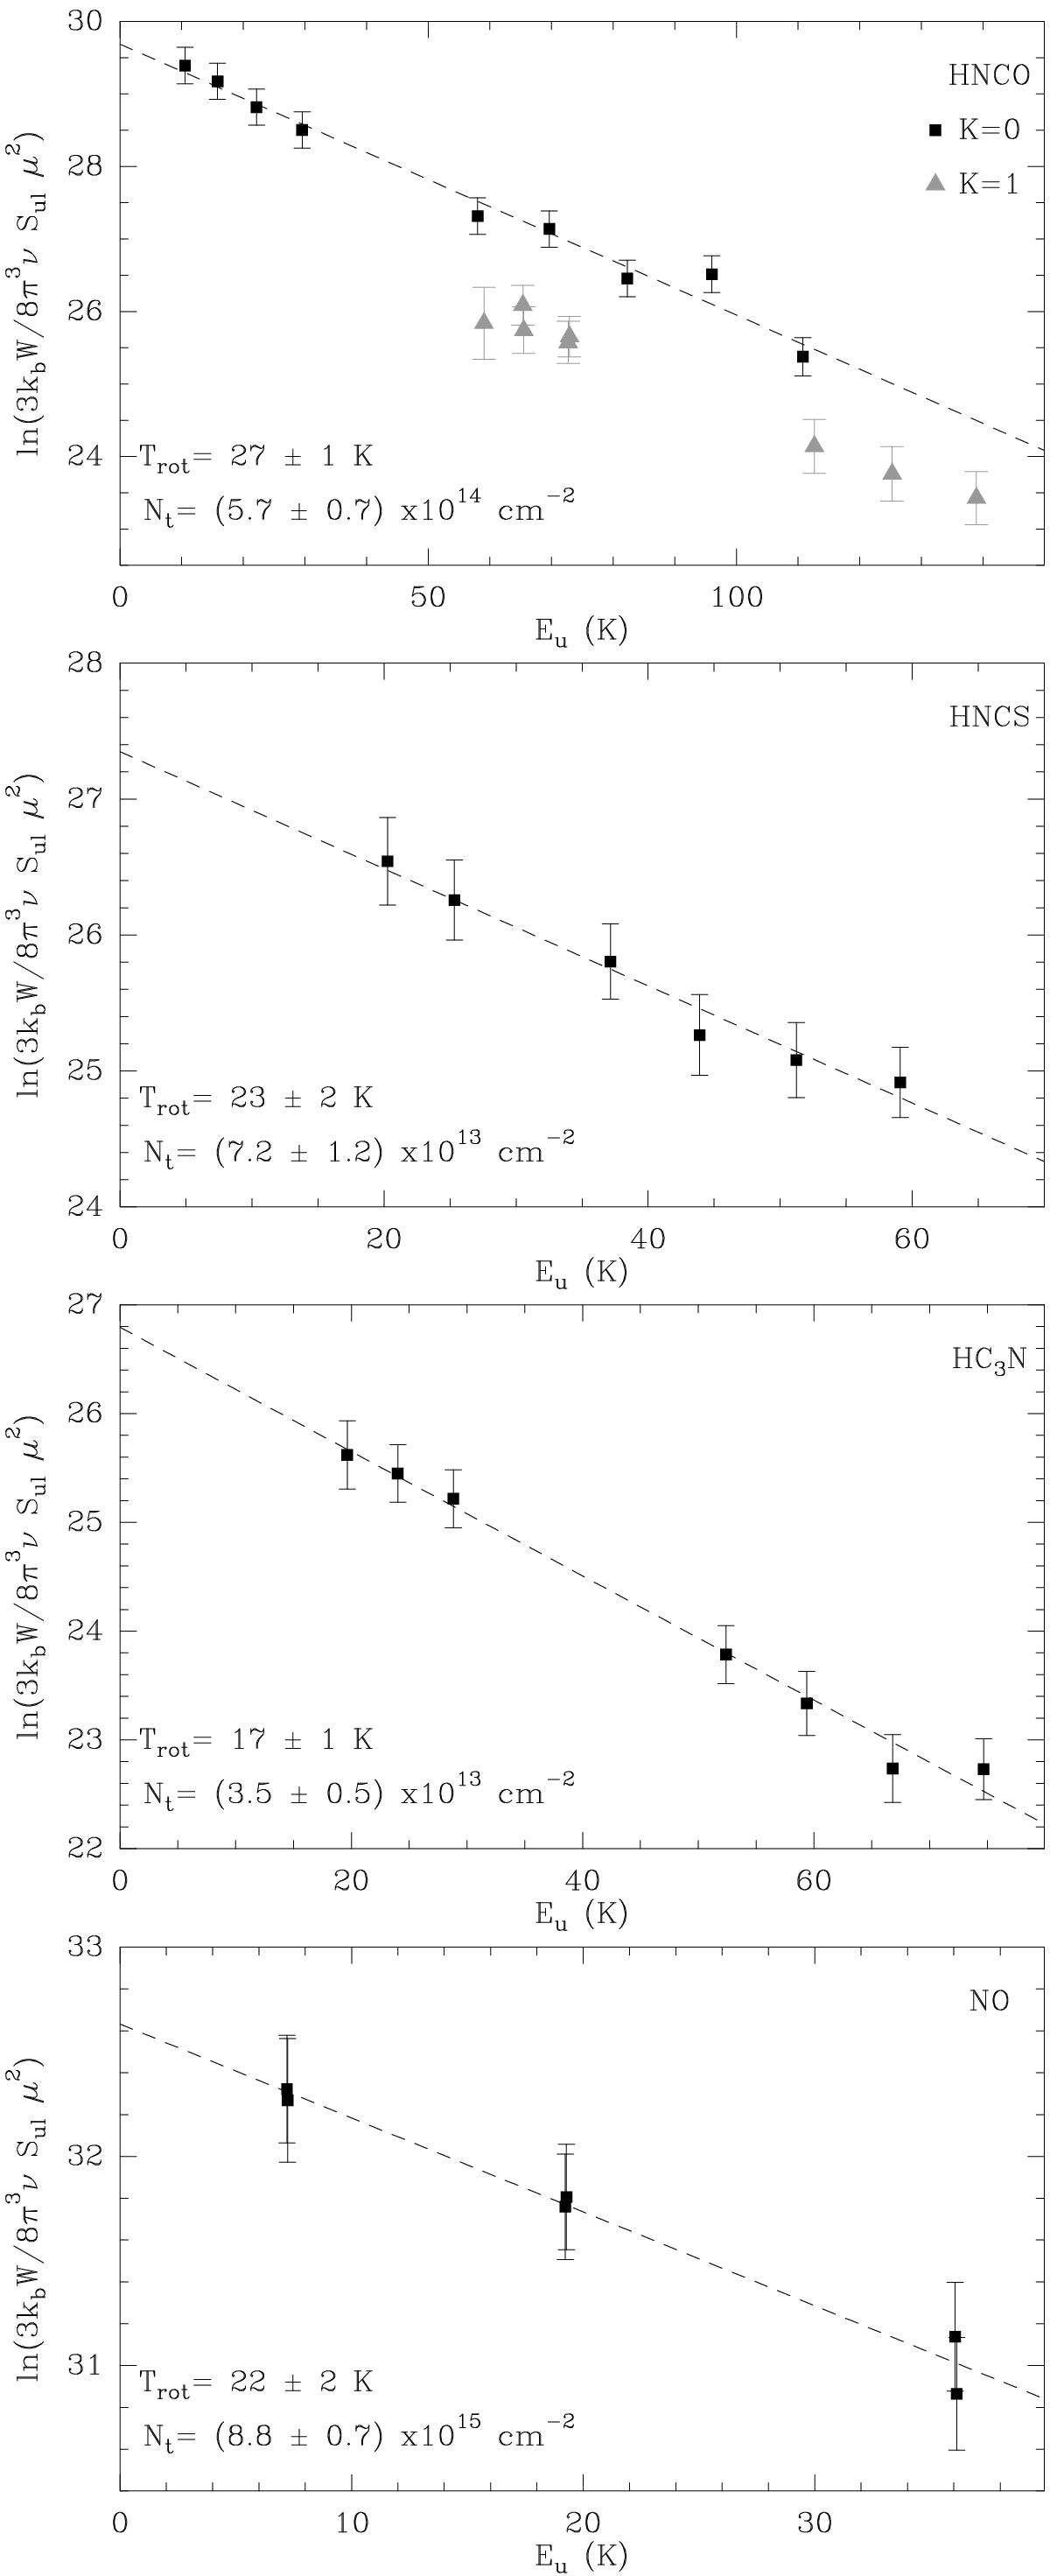
Population diagrams of HNCO, HNCS, HC3N, and NO (from top to bottom) and best linear fit (dashed line) to the data points (filled symbols; from Table 3). In the case of HNCO, black squares represent transitions with Ka = 0 and grey triangles the Ka = 1 transitions. The values of Trot and Ntot derived from the fit are indicated in the bottom left corner of each box. An opacity correction is not applied in these cases because all the transitions are optically thin. Error bars as in Fig. 8.
Current usage metrics show cumulative count of Article Views (full-text article views including HTML views, PDF and ePub downloads, according to the available data) and Abstracts Views on Vision4Press platform.
Data correspond to usage on the plateform after 2015. The current usage metrics is available 48-96 hours after online publication and is updated daily on week days.
Initial download of the metrics may take a while.