Fig. 8
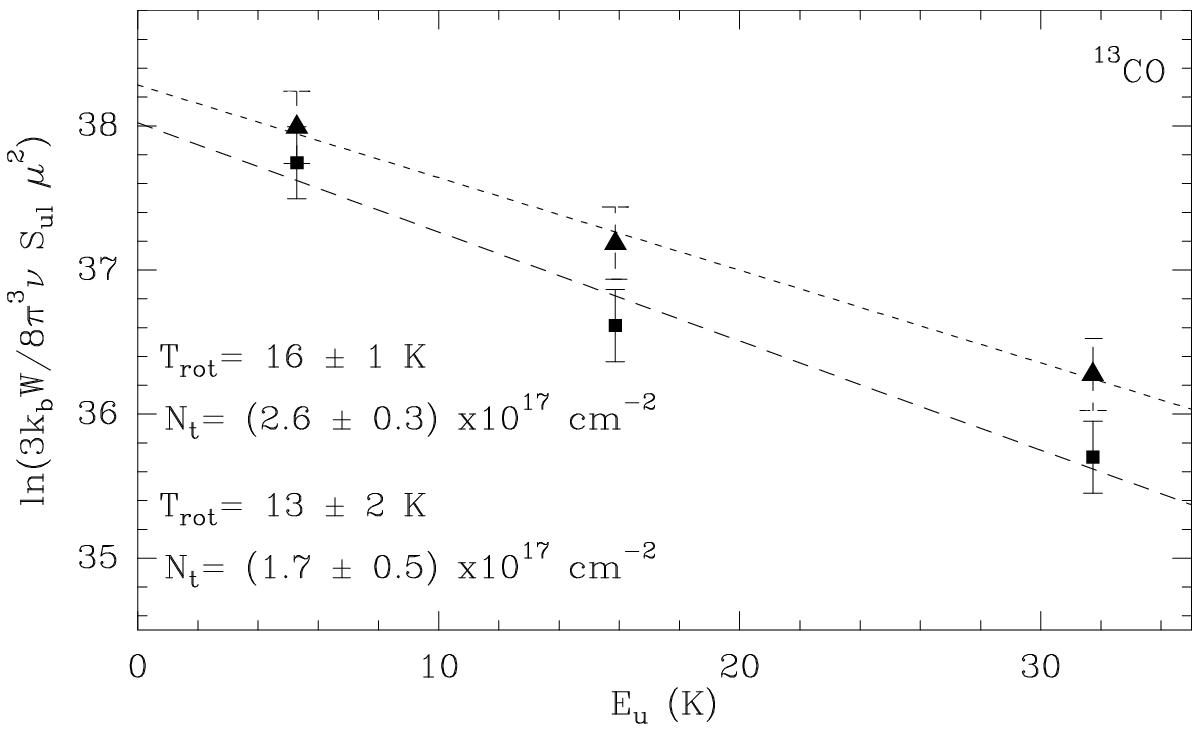
Population diagram for 13CO and best linear fit (dashed line) to the data (filled symbols). Triangles and squares represent data points with and without the opacity correction Cτ applied, respectively (Sect. 4.1). The values of Trot and Ntot derived from the fits are indicated in the bottom left corner of the box for the optically thin (lower) and optical depth corrected (upper) approximations. The error bars of the data points include flux uncertainties due to the rms of the spectra and absolute flux calibration, up to ~25% (Sect. 2).
Current usage metrics show cumulative count of Article Views (full-text article views including HTML views, PDF and ePub downloads, according to the available data) and Abstracts Views on Vision4Press platform.
Data correspond to usage on the plateform after 2015. The current usage metrics is available 48-96 hours after online publication and is updated daily on week days.
Initial download of the metrics may take a while.