Fig. 7
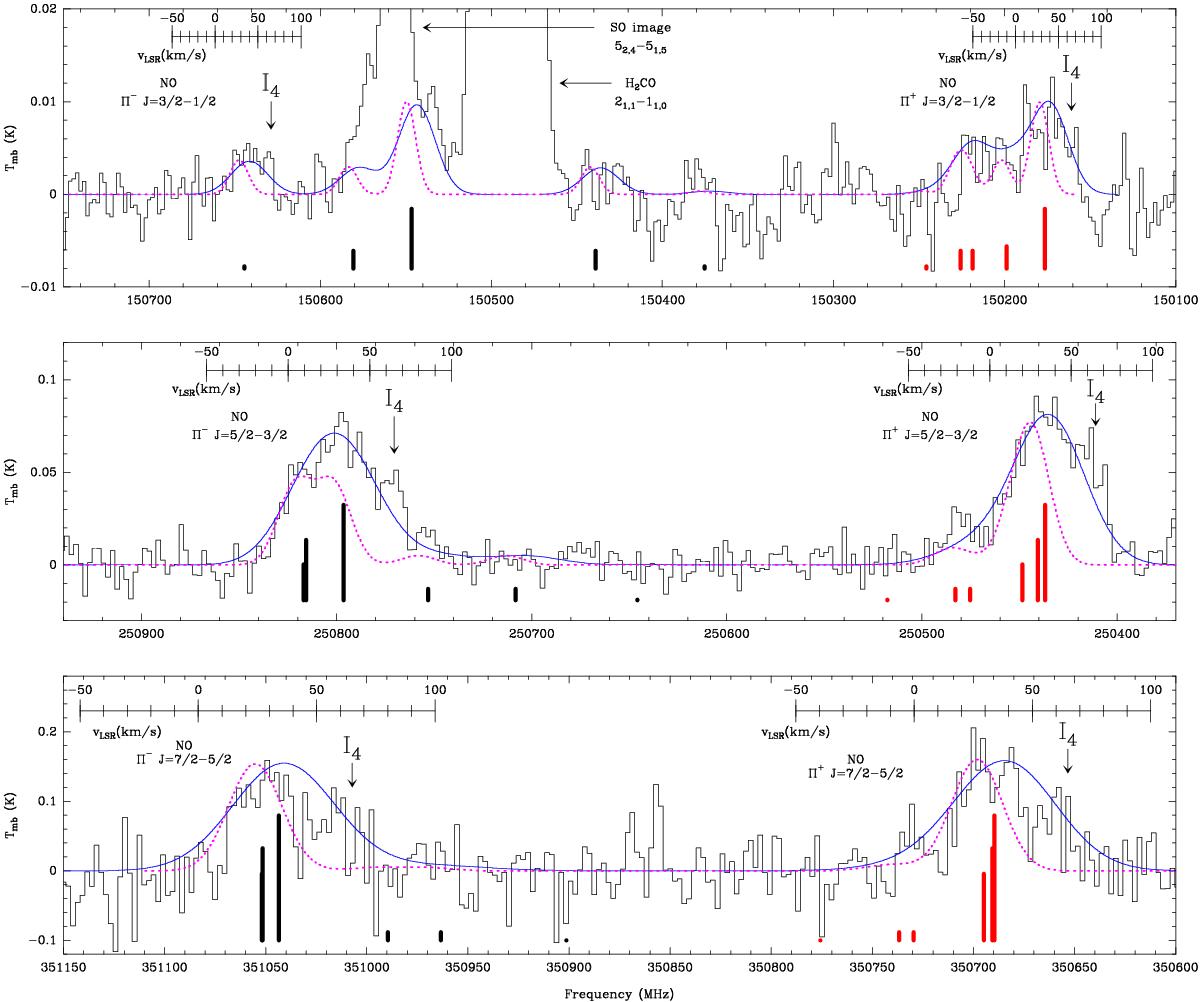
Spectra of the NO transitions detected in OH 231.8+4.2. The quantum numbers indicated in this plot for NO are Π and J (Table 3). Vertical thick segments indicate the rest frequency and relative strength of the individual hyperfine (hpf) components within each Π+ and Π− blend (red and black, respectively). The LSR velocity scale is shown on top of the NO transitions that have been detected (the velocity scale refers to the strongest hpf component in each case). The LSR velocity of the emission feature associated to clump I4, at the base of the southern lobe, is indicated. The dotted line is the model spectrum (Sect. 3.2 and Table 4) assuming that the individual hpf components are centred at VLSR = 28 km s-1, and have an intrinsic width of FWHM = 25 km s-1, similar to the dominant narrow component of the HNCO, HNCS, and HC3N profiles (Figs. 3–6). These line parameters cannot explain the broad profiles and the apparent overall redshift of the NO blends, which are reproduced better by adopting larger FWHM and VLSR (solid blue line: representative model with FWHM = 50 km s-1 and VLSR = 40 km s-1).
Current usage metrics show cumulative count of Article Views (full-text article views including HTML views, PDF and ePub downloads, according to the available data) and Abstracts Views on Vision4Press platform.
Data correspond to usage on the plateform after 2015. The current usage metrics is available 48-96 hours after online publication and is updated daily on week days.
Initial download of the metrics may take a while.