Fig. 2
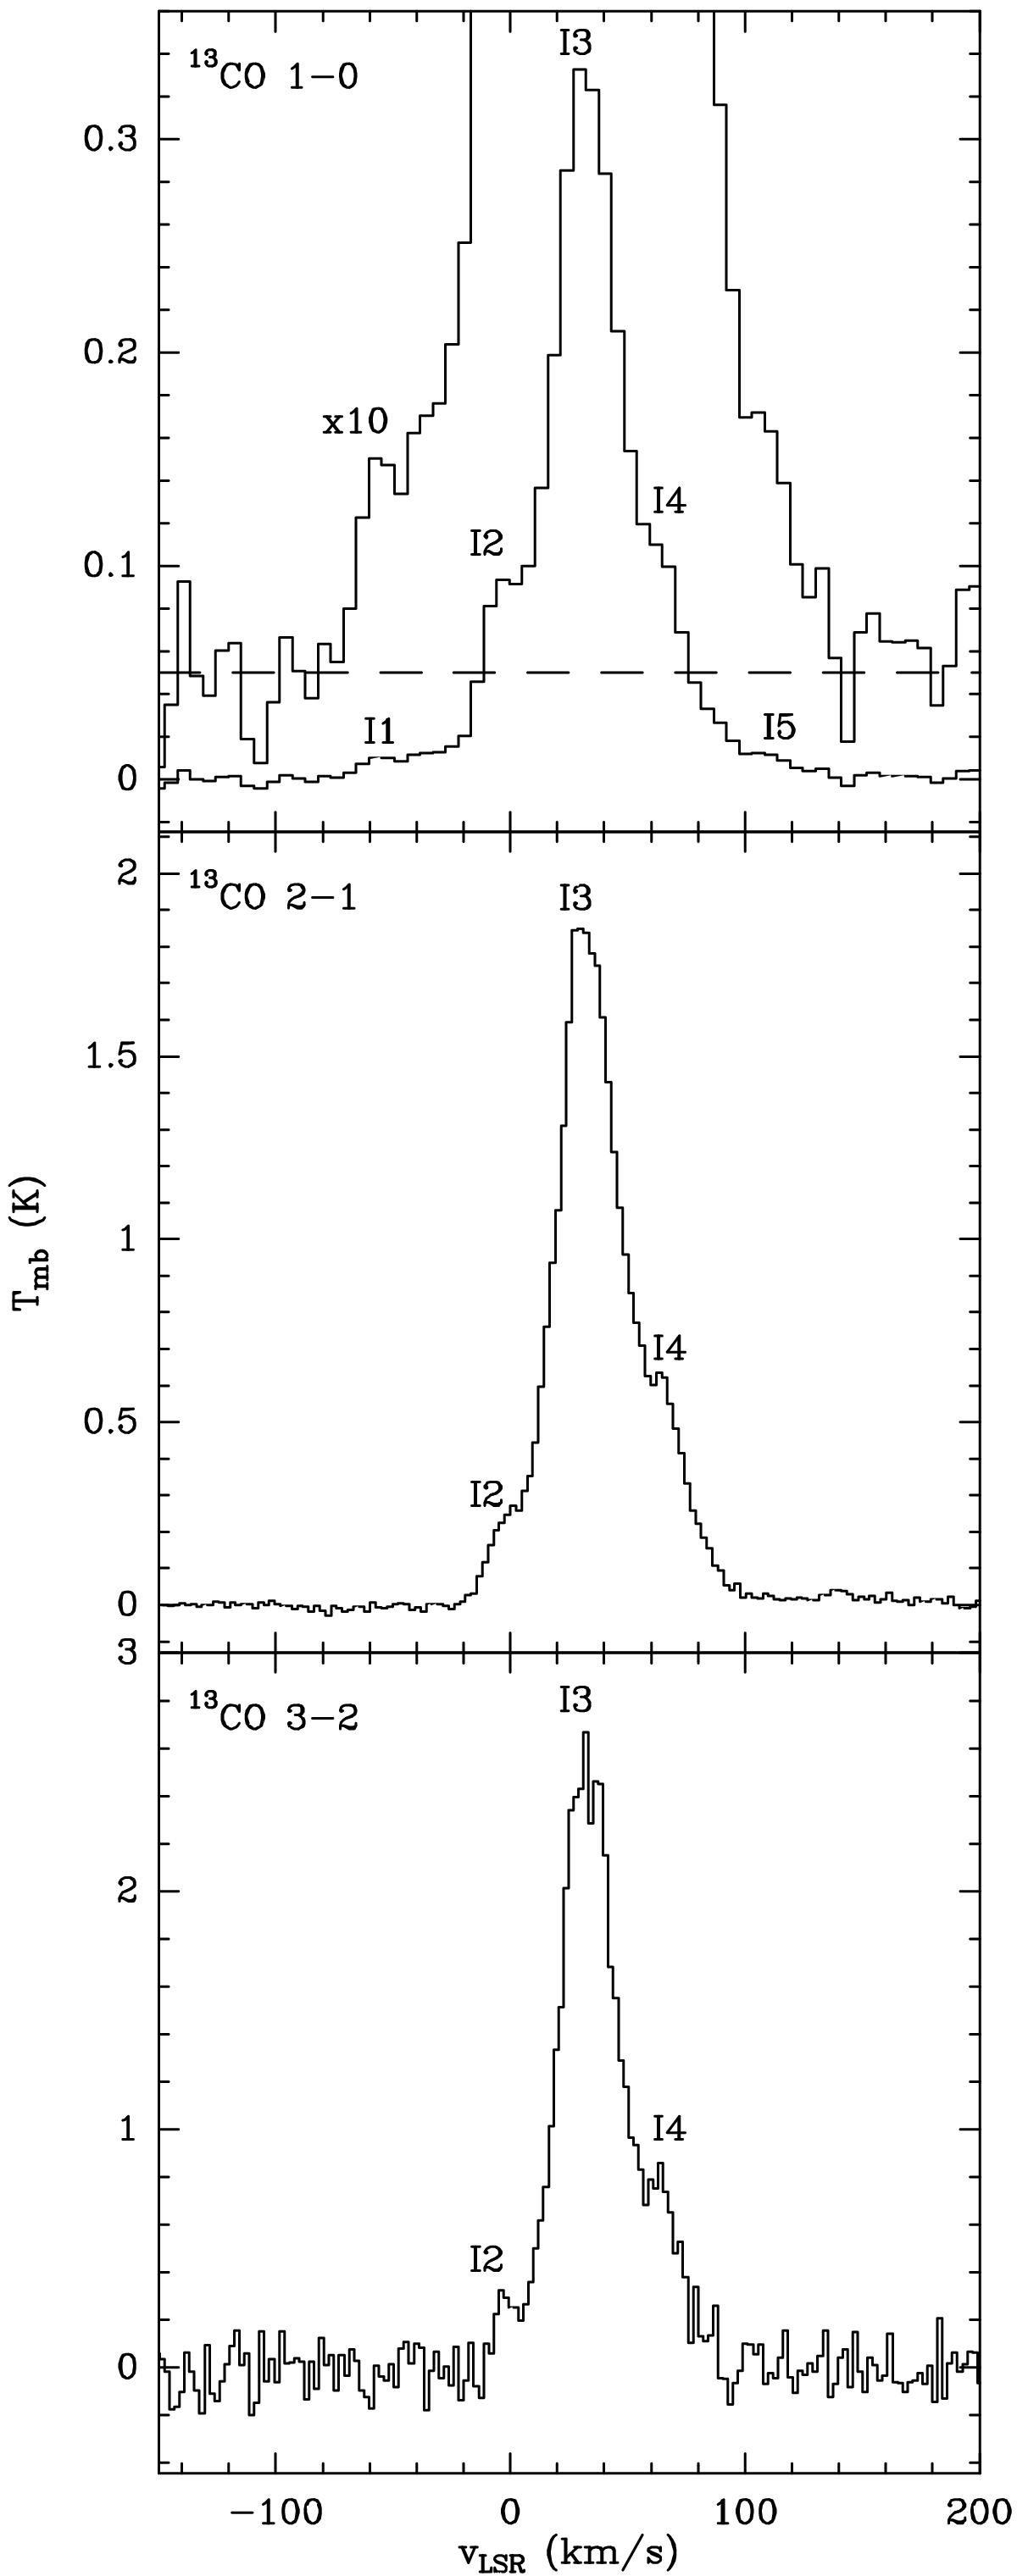
13CO mm-wavelength transitions in OH 231.8+4.2. We labelled the different spectral features in the 13CO profiles as I1–I5 to identify them with the corresponding regions/clumps of CO-outflow where the emission features mainly arise (see Fig. 1). Top panel: 13CO J = 1–0 spectrum is also plotted using a larger Tmb scale for an improved view of the weak broad wings.
Current usage metrics show cumulative count of Article Views (full-text article views including HTML views, PDF and ePub downloads, according to the available data) and Abstracts Views on Vision4Press platform.
Data correspond to usage on the plateform after 2015. The current usage metrics is available 48-96 hours after online publication and is updated daily on week days.
Initial download of the metrics may take a while.