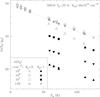
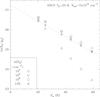
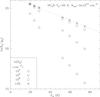
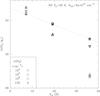
Fig. A.1

Population diagrams of HNCO, HNCS, HC3N, and NO for a range of molecular hydrogen densities (nH2, bottom left corner) and a given input value for the kinetic temperature and total column density (Tkin and Ntot; top right corner); the dotted line connects the LTE points. Only the transitions detected in this work are represented in this diagram (Table 3). For HNCO, the transitions within the Ka = 0 and Ka = 1 ladders are indicated by empty and filled symbols, respectively. For NO, we plot the three hyperfine components with the highest values of the Einstein coefficient (Aul) for each of the Π− and Π+ doublets at 250 and 350 GHz (i.e. at Eu = 19.2 and 36.1 K), the three hyperfine components with the largest Aul of the Π+ band at 150 GHz (i.e. at Eu = 7.2 K) and the Π−(3/2,3/2)–(1/2,1/2) line, which is spectrally isolated in our data, at 150 GHz (Eu = 7.2 K). These calculations have been done with a LVG radiative transfer code (MADEX) – see text in this appendix.
Current usage metrics show cumulative count of Article Views (full-text article views including HTML views, PDF and ePub downloads, according to the available data) and Abstracts Views on Vision4Press platform.
Data correspond to usage on the plateform after 2015. The current usage metrics is available 48-96 hours after online publication and is updated daily on week days.
Initial download of the metrics may take a while.