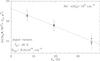
Fig. 10
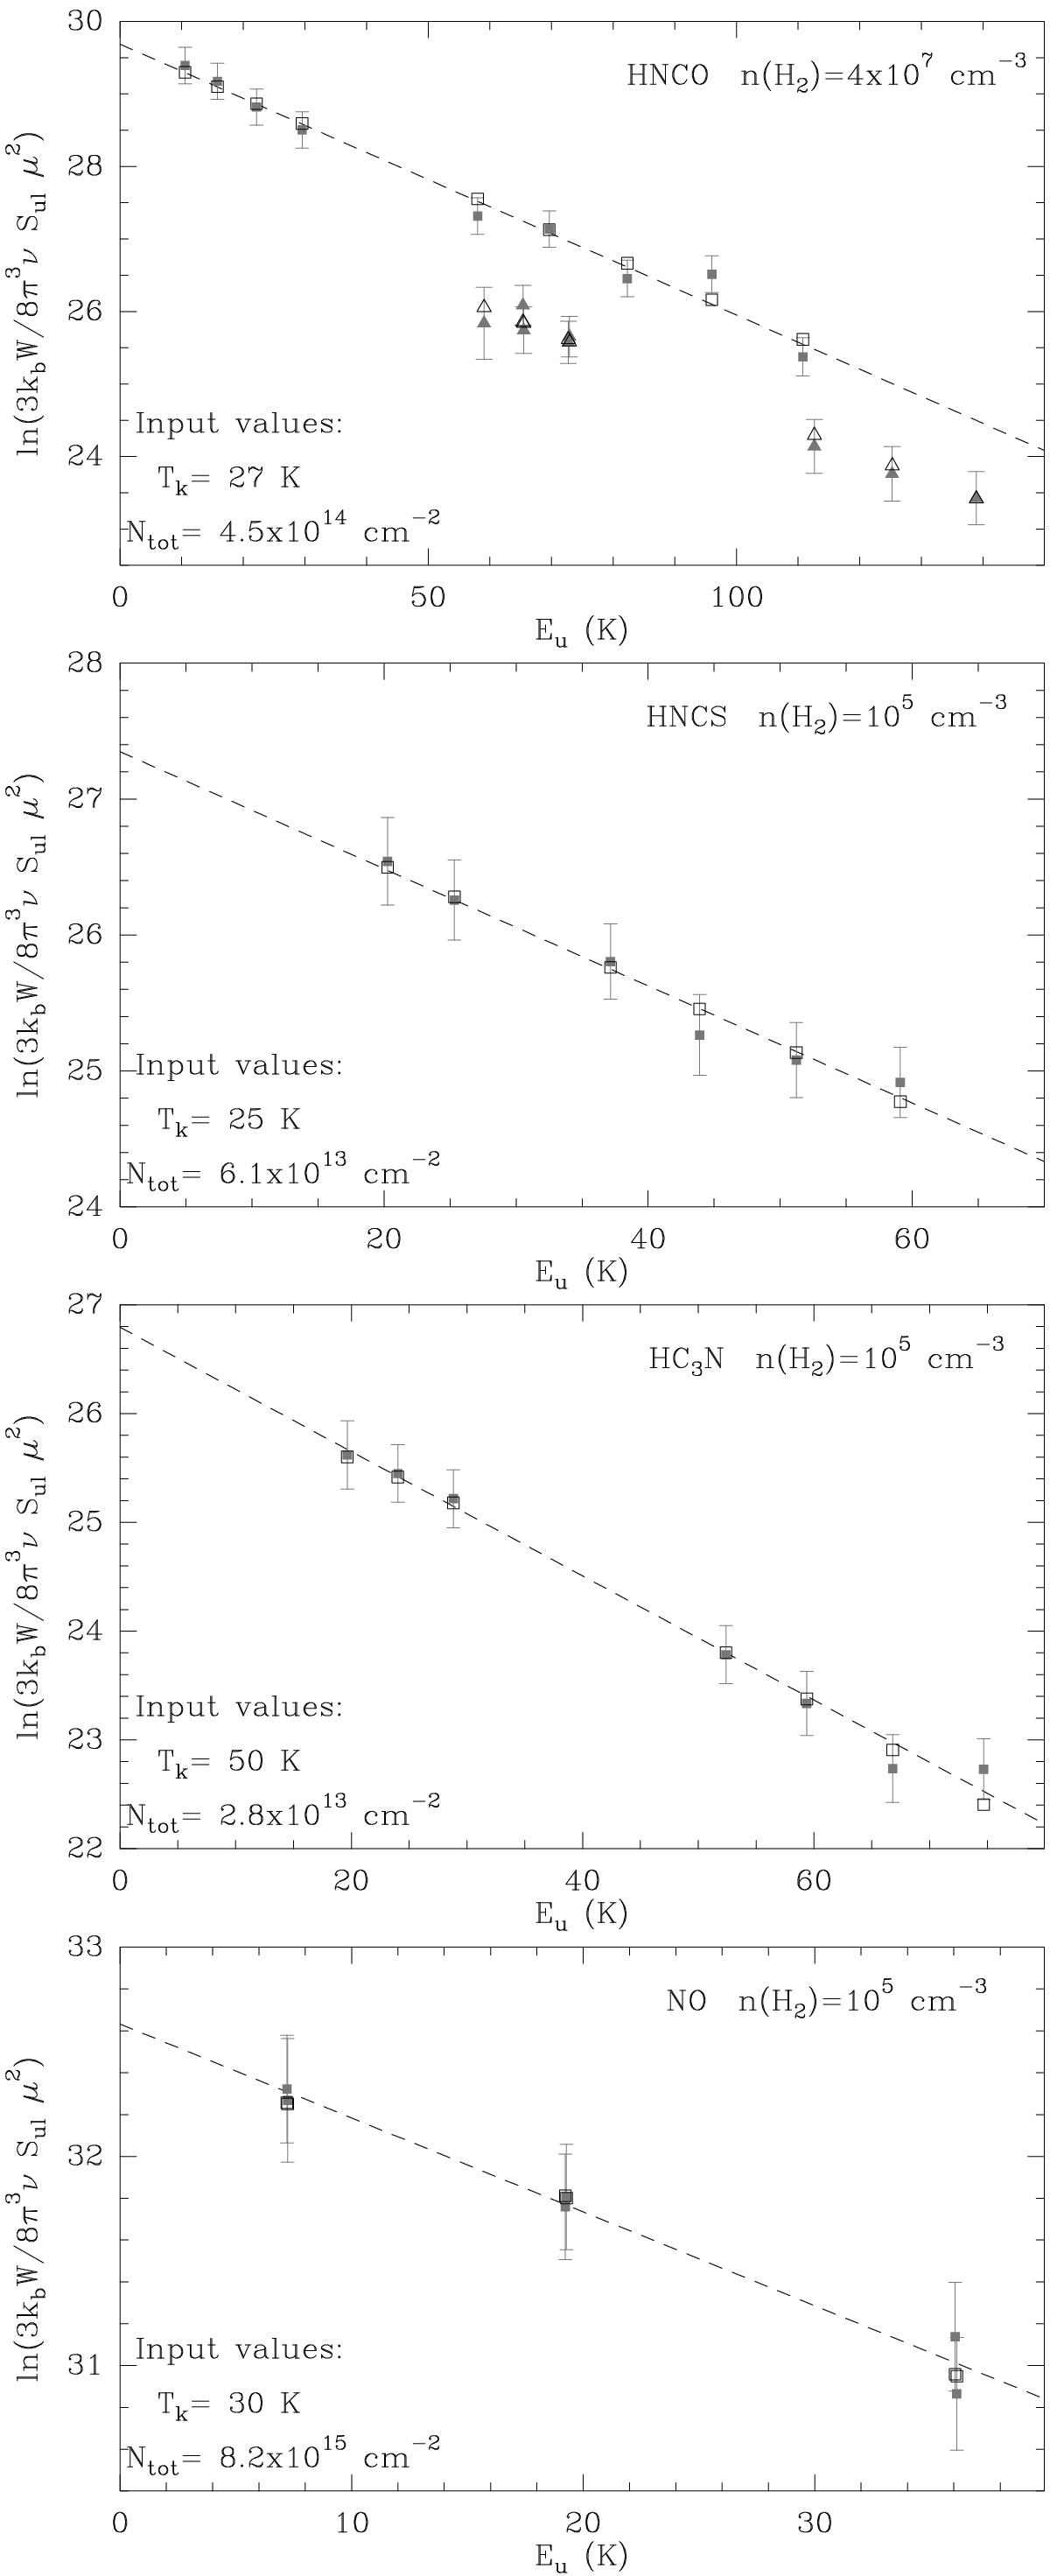
Population diagrams of HNCO, HNCS, HC3N, and NO including observational data points (filled symbols) and points from representative non-LTE models (empty symbols; Sect. 4.2). The main input parameters (nH2, Tkin, and Ntot) of the non-LTE models are indicated within the boxes, along with the linear fit to the data points (dashed line; same as in Fig. 9). For HNCO, squares and triangles represent the Ka = 0 and Ka = 1 transitions, respectively (as in Fig. 9).
Current usage metrics show cumulative count of Article Views (full-text article views including HTML views, PDF and ePub downloads, according to the available data) and Abstracts Views on Vision4Press platform.
Data correspond to usage on the plateform after 2015. The current usage metrics is available 48-96 hours after online publication and is updated daily on week days.
Initial download of the metrics may take a while.