Fig. 1
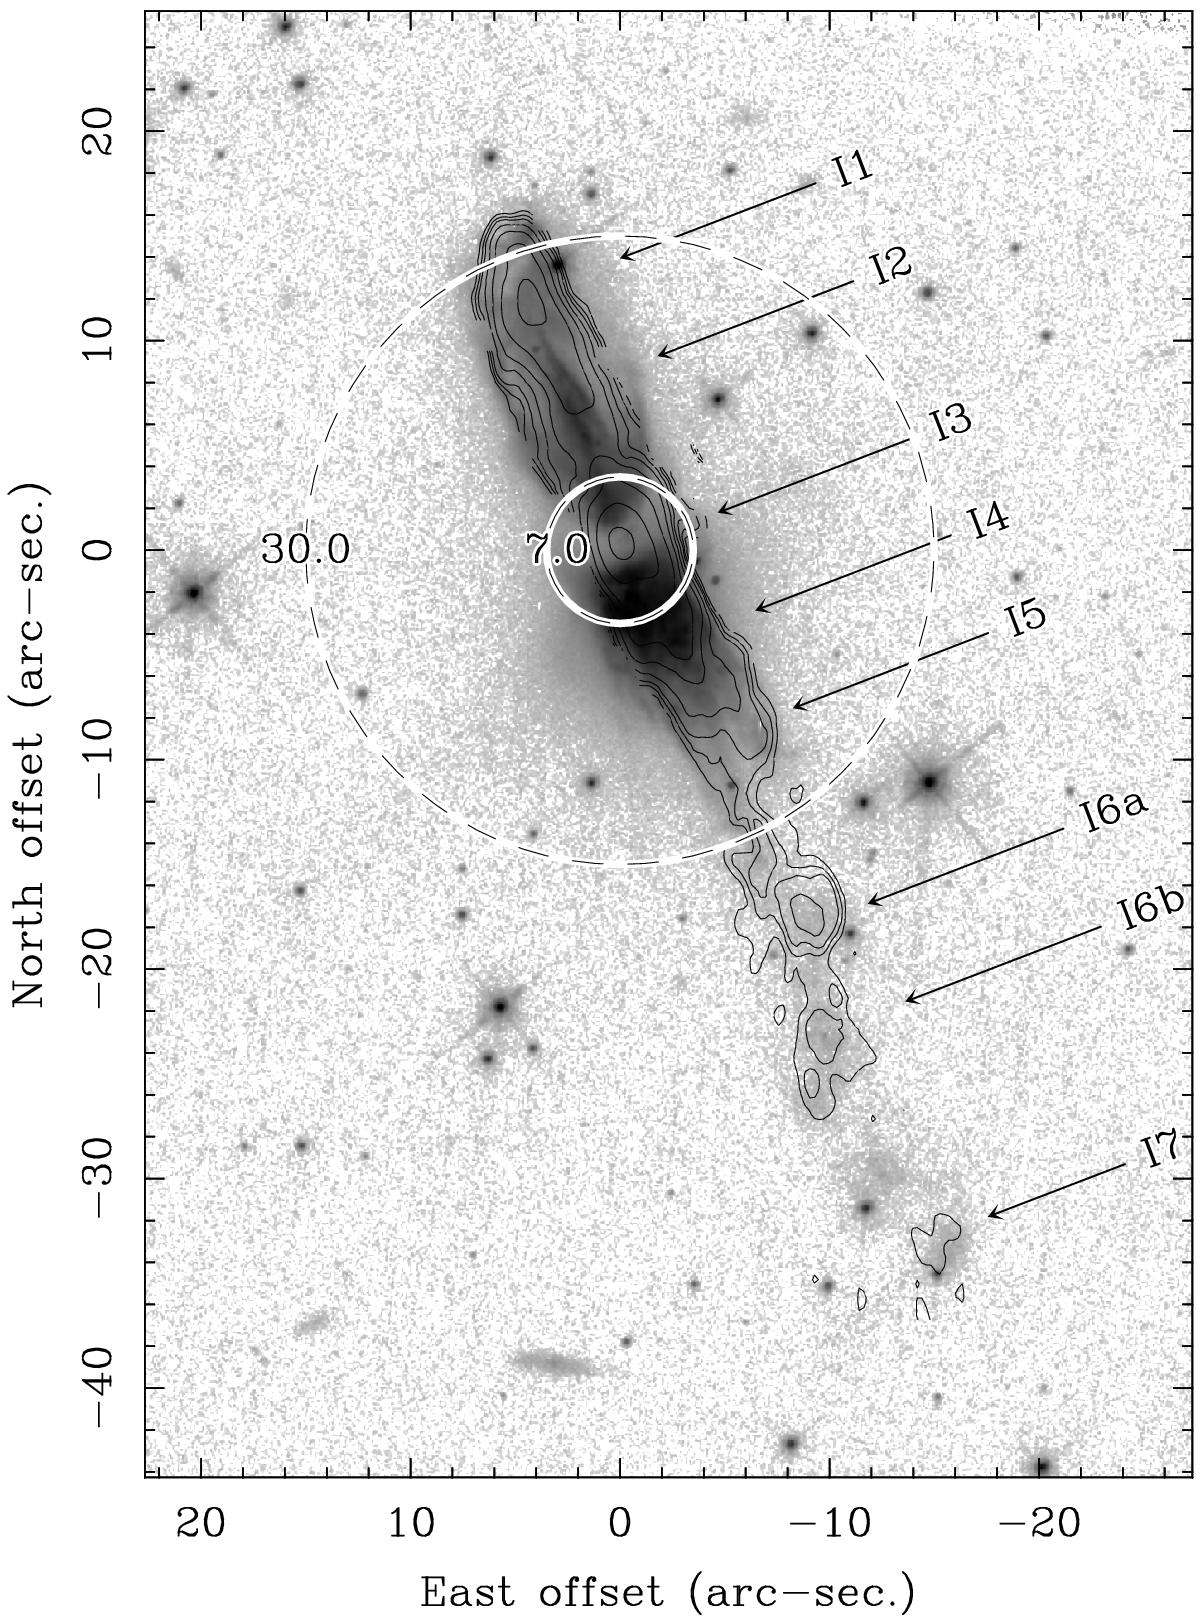
Composite image of OH 231.8+4.2 displaying: (grey scale) the dust distribution as observed with HST/WFPC2 and the broad-band F791W filter (Bujarrabal et al., 2002); (contours) the molecular outflow as traced by the 12CO (2–1) emission (velocity integrated) mapped with 1.̋5 × 0.̋7-resolution (see Fig. 4 in Alcolea et al., 2001). The dashed circles show the area covered by the largest and smallest telescope beams (HPBW) of the IRAM-30 m observations presented in this work. The different emitting clumps, I1-I7, are labelled as in Alcolea et al. (2001). The VLSR range (in km s-1) of each clump is I1) [−80:−30], I2) [−30:+10], I3) [+10:+55], I4) [+55:+80], I5) [+80:+150], I6a) [+150:+205], I6b) [+205:+230], and I7) [+230:+285] (see Table 2 in Alcolea et al., 2001, for more details on the physical properies of the clumps).
Current usage metrics show cumulative count of Article Views (full-text article views including HTML views, PDF and ePub downloads, according to the available data) and Abstracts Views on Vision4Press platform.
Data correspond to usage on the plateform after 2015. The current usage metrics is available 48-96 hours after online publication and is updated daily on week days.
Initial download of the metrics may take a while.