Free Access
Fig. 3
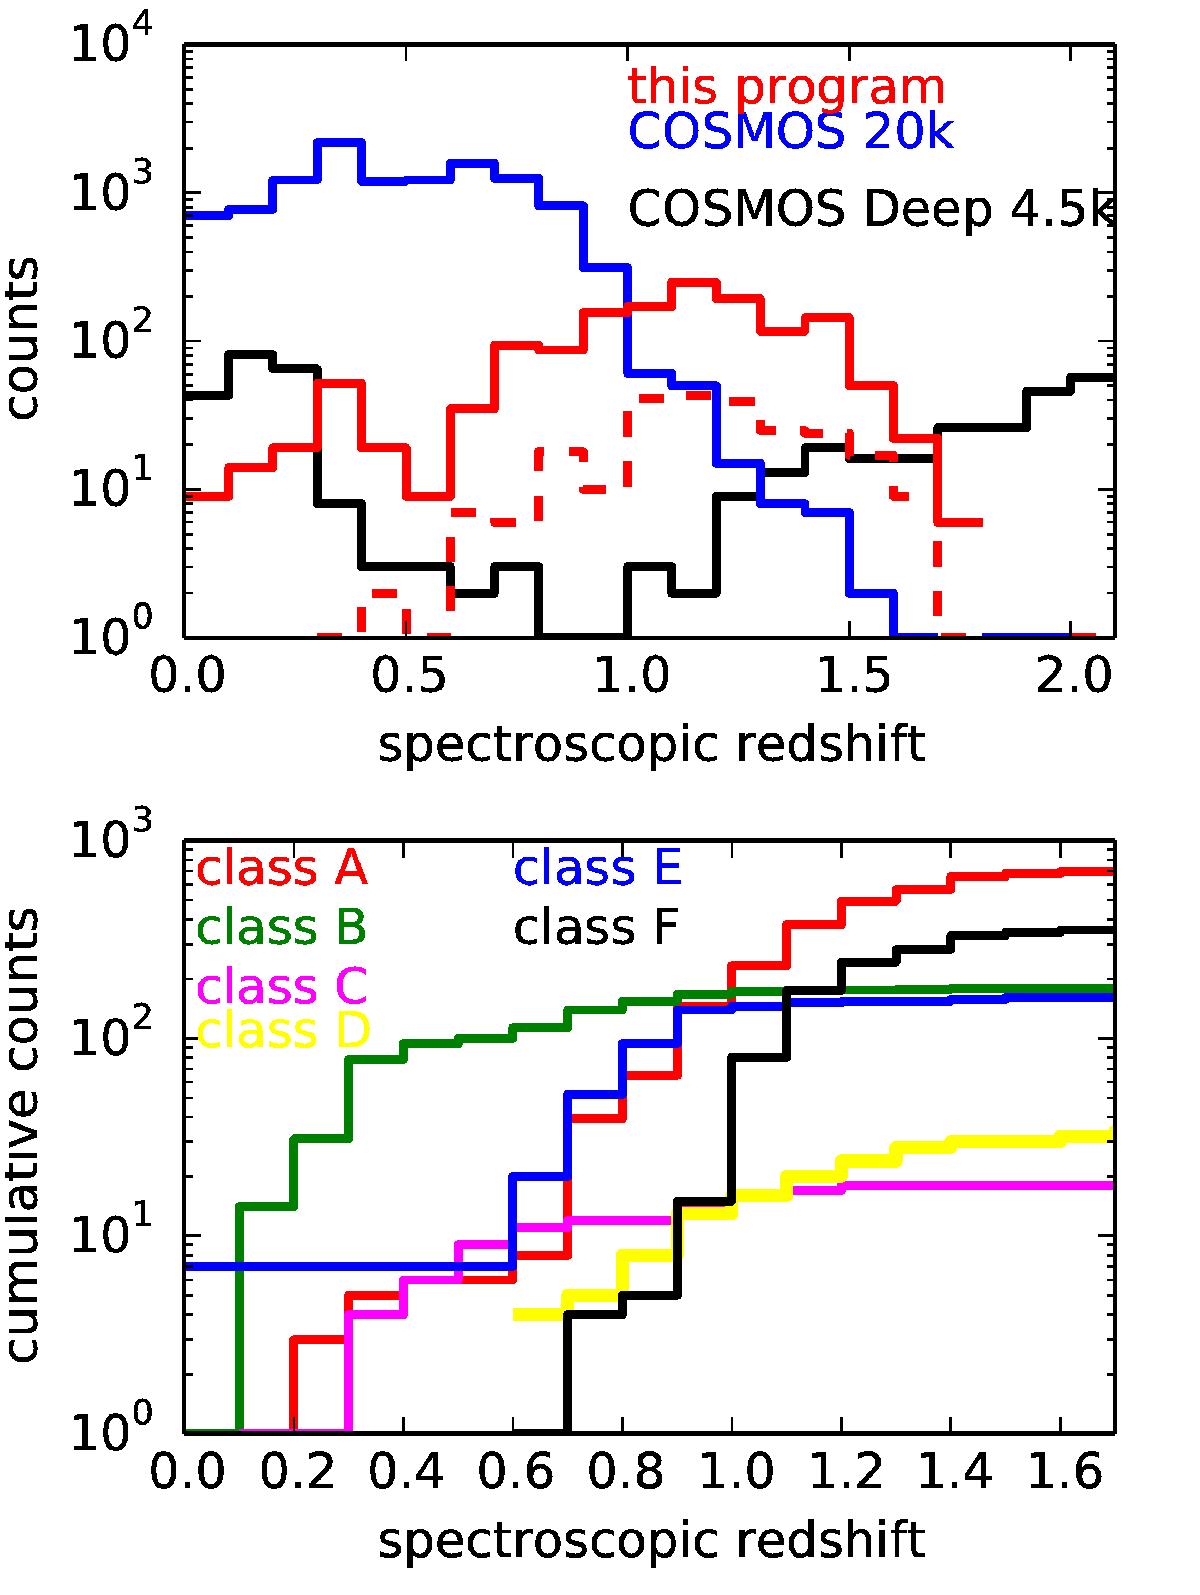
Redshift distributions. Top: distribution of our sample (red solid line for Q = 3 or 4, dashed line for Q = 2) compared to previous spectroscopic programs on COSMOS: the COSMOS deep 4.5 k (black) and COSMOS 20 k (blue). Bottom: quality 3 or 4 redshift cumulative distributions for each class of target in our sample.
This figure is made of several images, please see below:
Current usage metrics show cumulative count of Article Views (full-text article views including HTML views, PDF and ePub downloads, according to the available data) and Abstracts Views on Vision4Press platform.
Data correspond to usage on the plateform after 2015. The current usage metrics is available 48-96 hours after online publication and is updated daily on week days.
Initial download of the metrics may take a while.