Free Access
Fig. 2
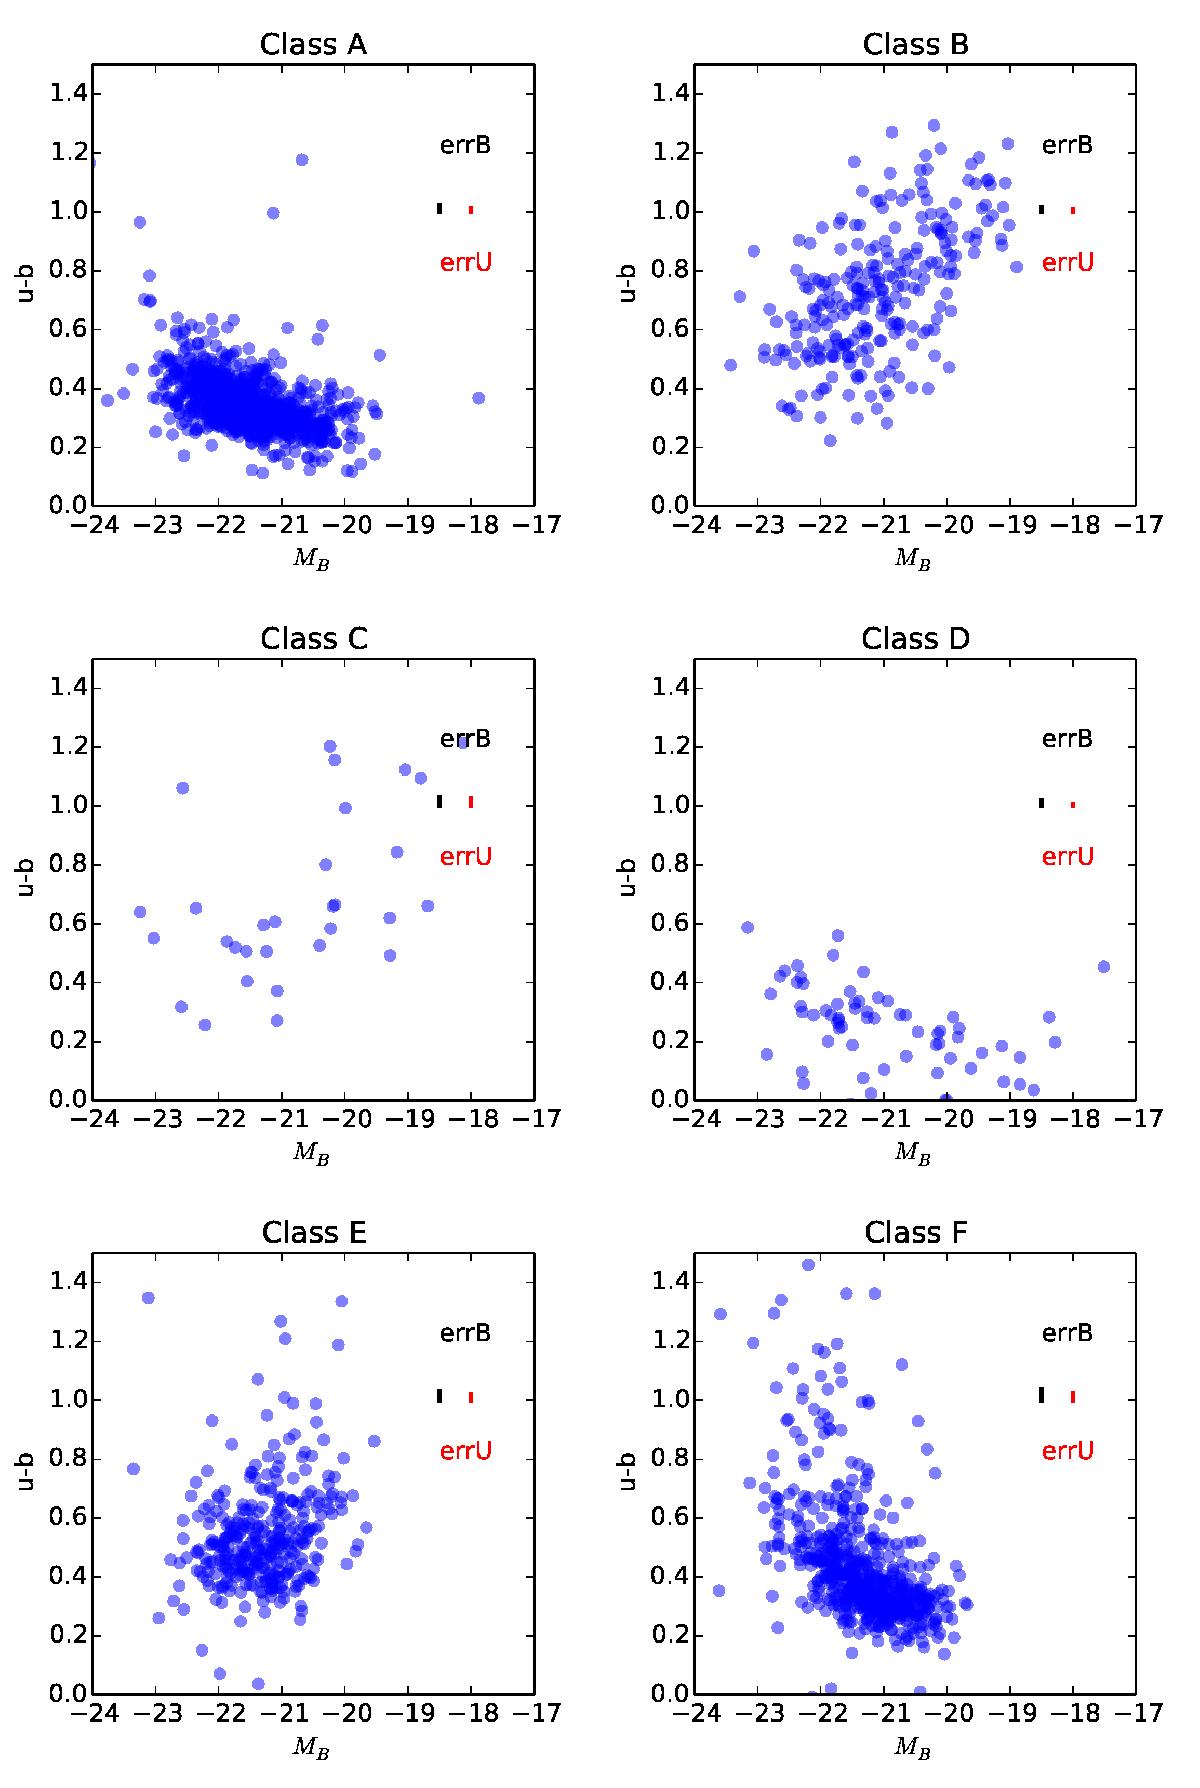
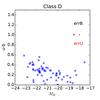
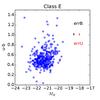
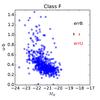
Selection. u − b color vs. MB absolute magnitude for each selection with MB derived using the photometric redshift. The vertical bars show the mean 1σ error on the u and b bands for each selection. Class A objects are bright and blue.
This figure is made of several images, please see below:
Current usage metrics show cumulative count of Article Views (full-text article views including HTML views, PDF and ePub downloads, according to the available data) and Abstracts Views on Vision4Press platform.
Data correspond to usage on the plateform after 2015. The current usage metrics is available 48-96 hours after online publication and is updated daily on week days.
Initial download of the metrics may take a while.