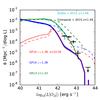
Fig. 16
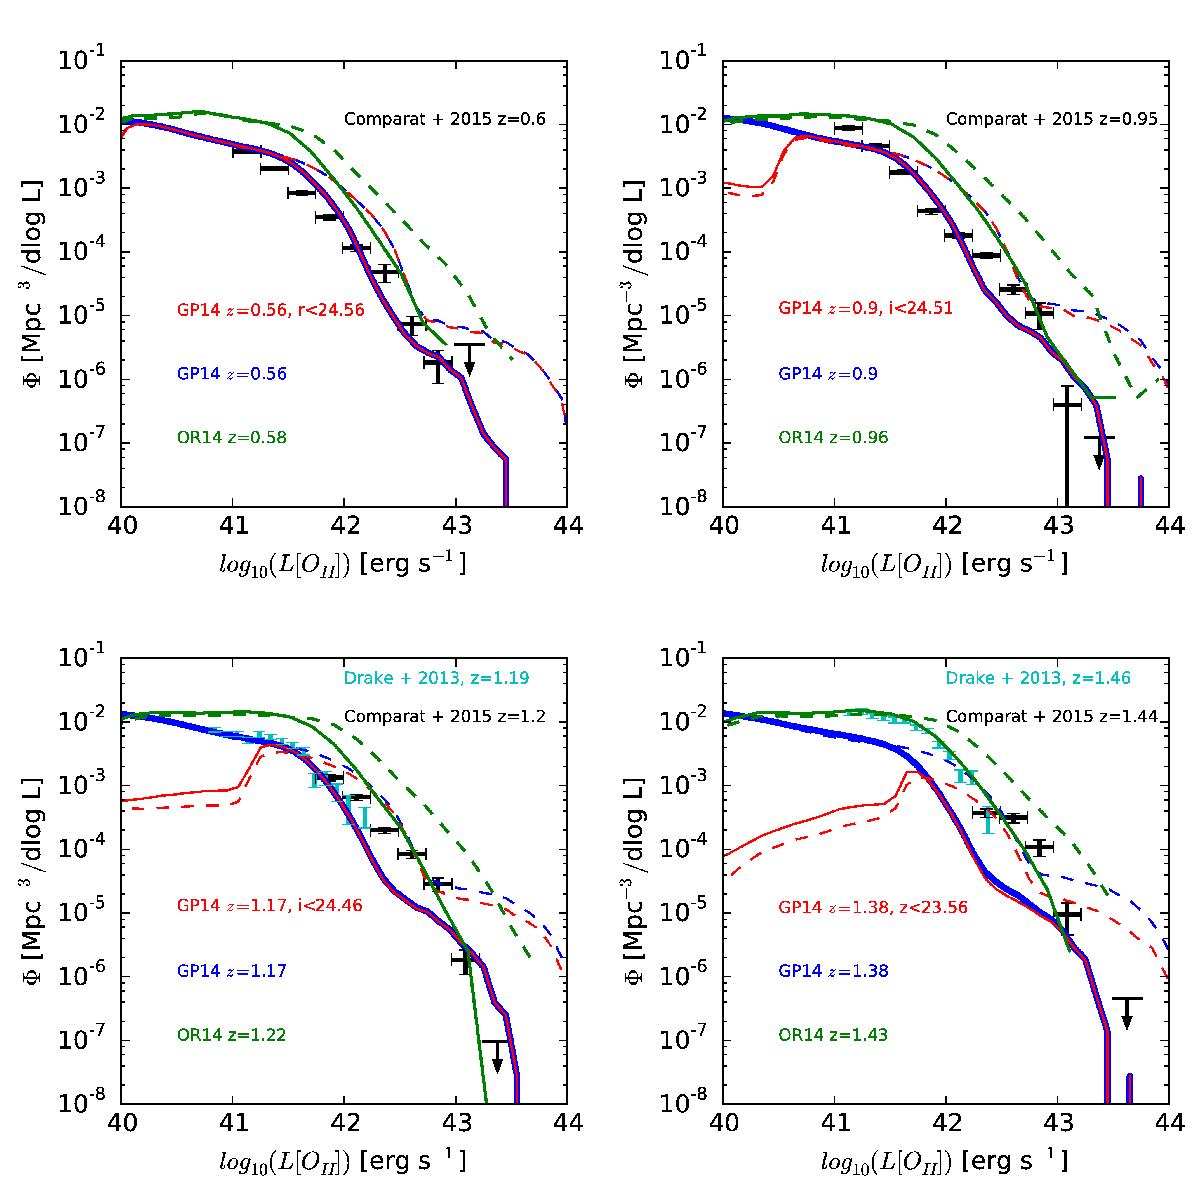
Our observed LF (black symbols) compared to the predictions from the GP14 (solid blue lines) and the OR14 model (solid green lines). The solid red lines show the predictions from the GP14 model when an extra cut in magnitude is included, as indicated in each legend. The corresponding predictions without including the dust attenuation are shown as dashed lines of the corresponding color. We have also included for comparison the observational data from Drake et al. (2013) as cyan symbols.
Current usage metrics show cumulative count of Article Views (full-text article views including HTML views, PDF and ePub downloads, according to the available data) and Abstracts Views on Vision4Press platform.
Data correspond to usage on the plateform after 2015. The current usage metrics is available 48-96 hours after online publication and is updated daily on week days.
Initial download of the metrics may take a while.