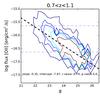
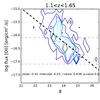
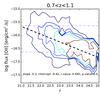
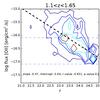
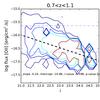
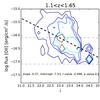
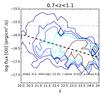
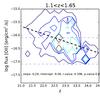
Fig. 15
Correlations between the broadband magnitudes and the [Oii] flux. The contours represent the density of galaxies predicted by the weighted data (from dark blue to brown 10, 50, 100, 200, 500 galaxy deg-2). The g band correlates best in the redshift range 0.7 <z< 1.1. The r magnitude correlates best in the range 1.3 <z< 1.6. The fluxes corresponding to a luminosity of 1041 and 1042 erg s-1 and the mean redshift (0.9 and 1.3) are represented by dashed blue lines.
Current usage metrics show cumulative count of Article Views (full-text article views including HTML views, PDF and ePub downloads, according to the available data) and Abstracts Views on Vision4Press platform.
Data correspond to usage on the plateform after 2015. The current usage metrics is available 48-96 hours after online publication and is updated daily on week days.
Initial download of the metrics may take a while.