Fig. 11
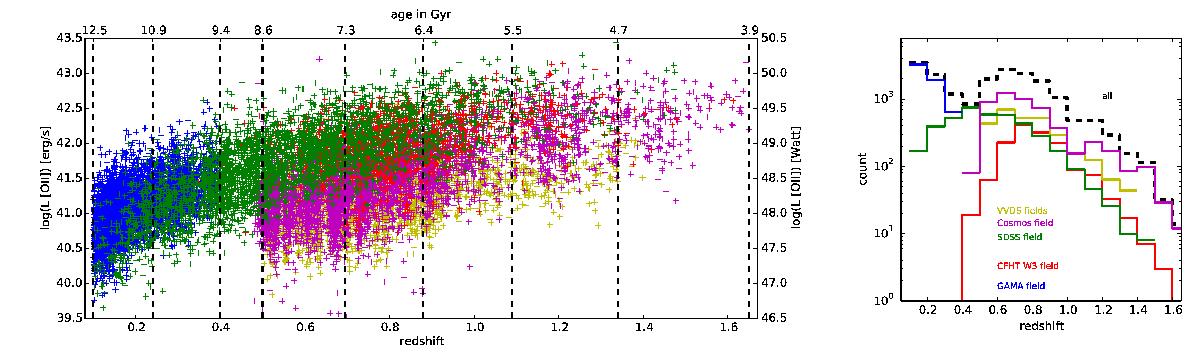
Left panel: luminosity vs. redshift. In each redshift bin the horizontal black lines show the 5σ completeness limit of the data presented, except in the 0.4 <z< 0.5 where we show the high completeness limit (see Sect. 4.1 for details). Right panel: redshift distribution by survey, on the Cosmos field (purple), on the CFHT-LS W3 field (red), and on the SCUSS – SDSS field (green).
Current usage metrics show cumulative count of Article Views (full-text article views including HTML views, PDF and ePub downloads, according to the available data) and Abstracts Views on Vision4Press platform.
Data correspond to usage on the plateform after 2015. The current usage metrics is available 48-96 hours after online publication and is updated daily on week days.
Initial download of the metrics may take a while.