Fig. A.1
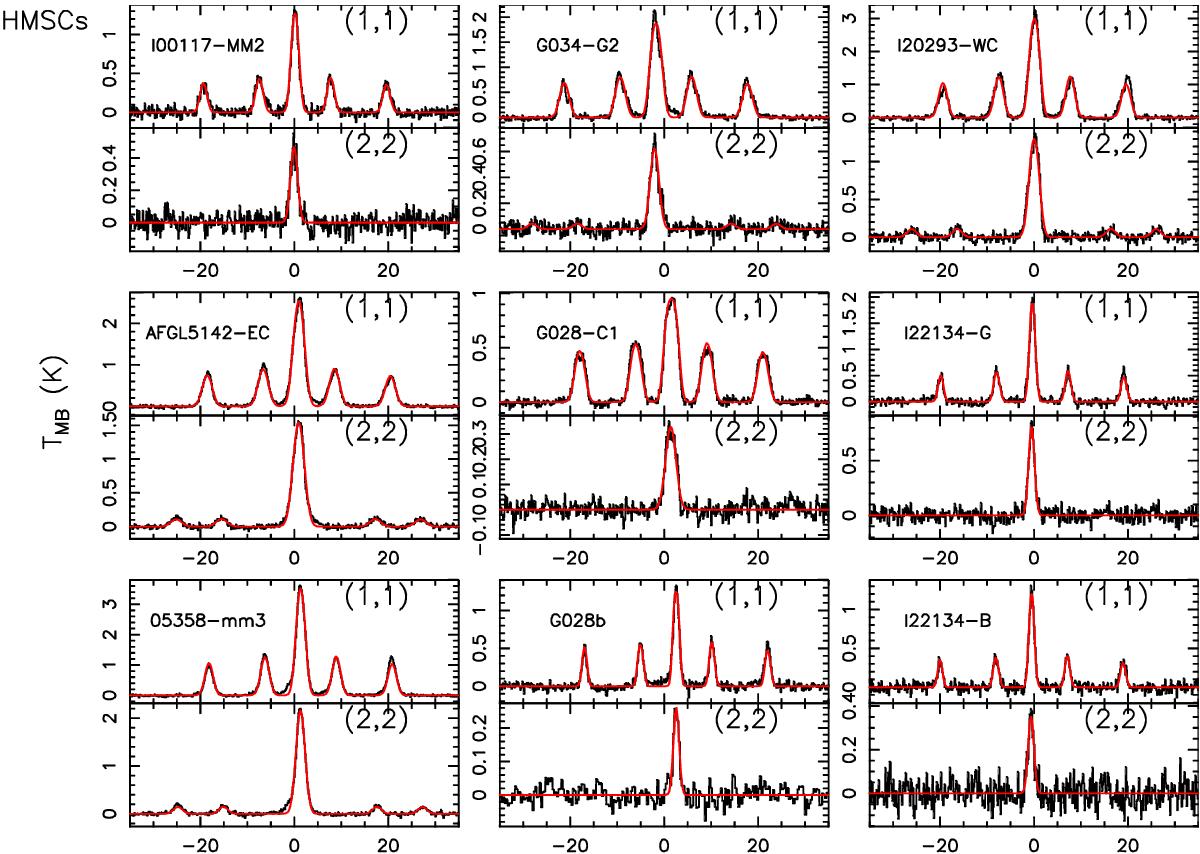
GBT spectra of NH3(1,1) and (2,2) obtained towards the sources classified as HMSCs. For each spectrum, the x-axis represents a velocity interval of ± 35 km s-1 from the systemic velocity listed in Table 1. The y-axis shows the intensity scale in main beam brightness temperature units. In each spectrum, the red curve indicates the best fit either obtained by fitting the hyperfine structure, when possible, or with a single Gaussian (see Sect. 3.1).
Current usage metrics show cumulative count of Article Views (full-text article views including HTML views, PDF and ePub downloads, according to the available data) and Abstracts Views on Vision4Press platform.
Data correspond to usage on the plateform after 2015. The current usage metrics is available 48-96 hours after online publication and is updated daily on week days.
Initial download of the metrics may take a while.