Fig. 7
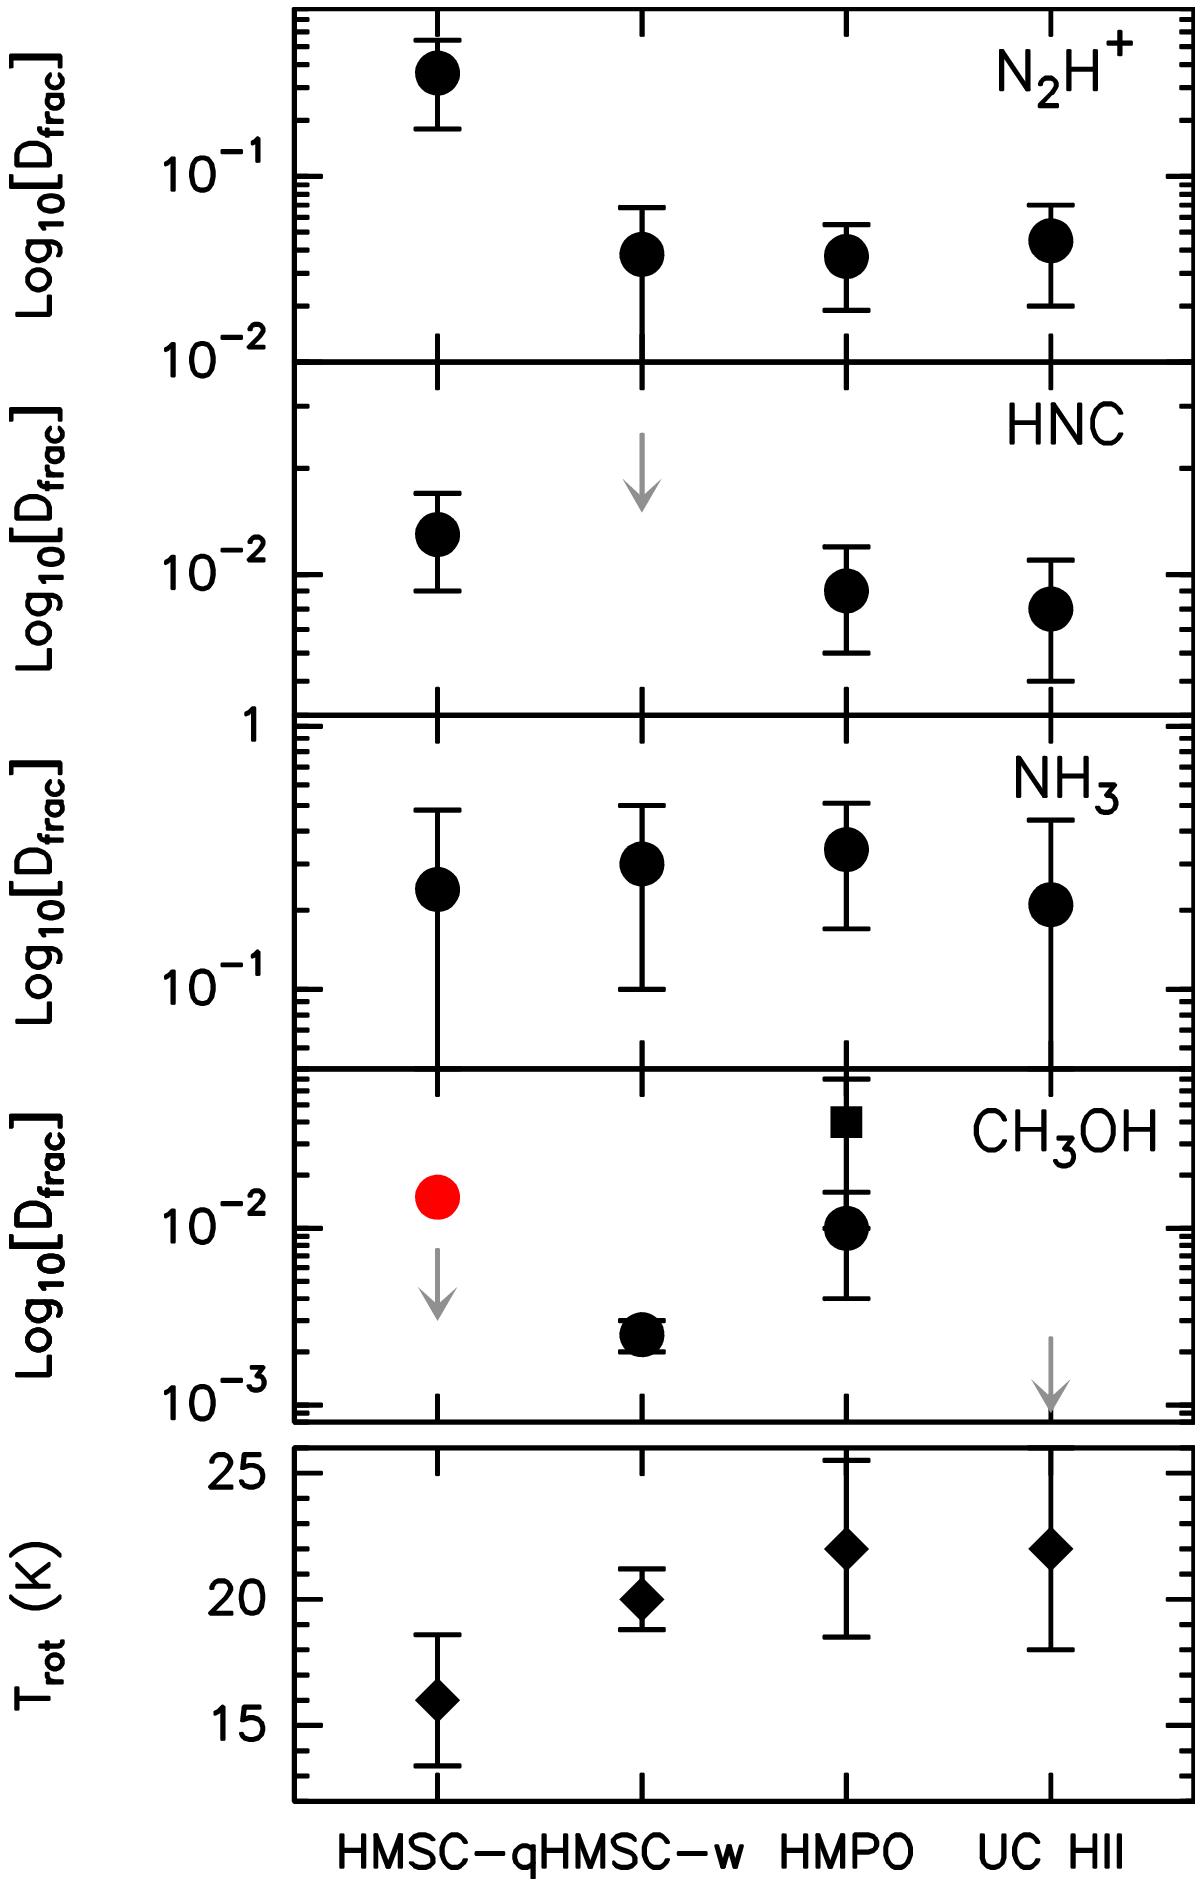
Panels one to four, from top: comparison between the mean deuterated fractions (black dots) of N2H+ (first panel, Paper I), HNC (second panel, Paper II) NH3 and CH3OH (third and fourth panels, this work). The mean values have been computed for each evolutionary group. Quiescent HMSCs (HMSC-q) and warm HMSCs (HMSC-w) have been treated separately. The error bars indicate the standard deviation. The grey arrows represent mean upper limits for those evolutionary groups in which no sources have been detected. The red dot in the fourth panel represents the doubtful CH2DOH detection in G034-G2 (see Sect. 4.4), while the square indicates the mean Dfrac of HMPOs when N(CH2DOH) is derived from rotation diagrams for AFGL5142–MM and 18089–732. Bottom panel: mean rotation temperatures (filled diamonds) derived from ammonia in the four groups (see Table 7).
Current usage metrics show cumulative count of Article Views (full-text article views including HTML views, PDF and ePub downloads, according to the available data) and Abstracts Views on Vision4Press platform.
Data correspond to usage on the plateform after 2015. The current usage metrics is available 48-96 hours after online publication and is updated daily on week days.
Initial download of the metrics may take a while.