Fig. 4
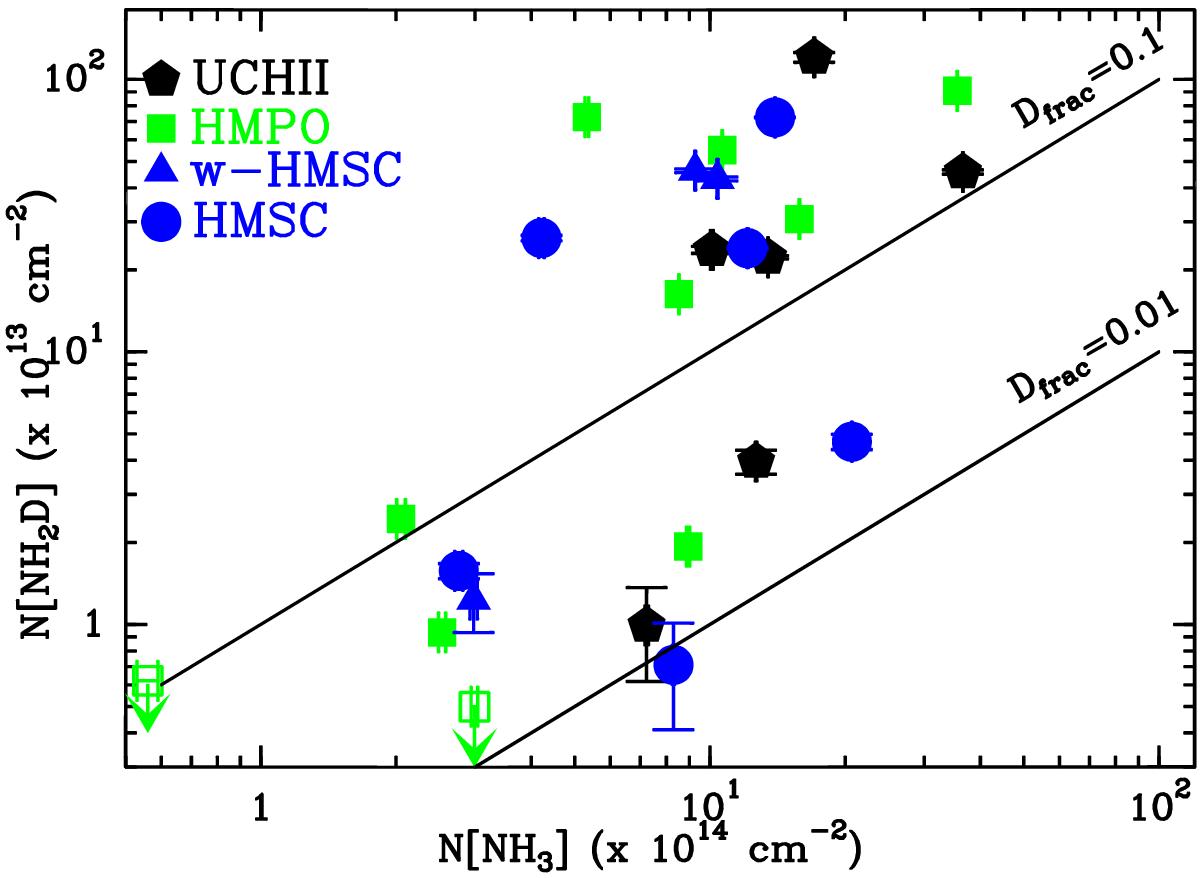
Comparison between the total column density of NH2D, N(NH2D), and NH3, N(NH3). Blue symbols correspond to HMSCs (triangles: warm cores, see Sect. 2); green squares show HMPOs (open squares are upper limits); black pentagons correspond to UC Hii regions. In most cases, the error bars are barely visible because comparable to (or smaller than) the size of the symbol. The straight lines represent the loci of Dfrac(NH3) = 0.01 and 0.1.
Current usage metrics show cumulative count of Article Views (full-text article views including HTML views, PDF and ePub downloads, according to the available data) and Abstracts Views on Vision4Press platform.
Data correspond to usage on the plateform after 2015. The current usage metrics is available 48-96 hours after online publication and is updated daily on week days.
Initial download of the metrics may take a while.