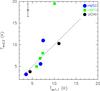
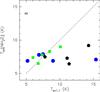
Fig. 3
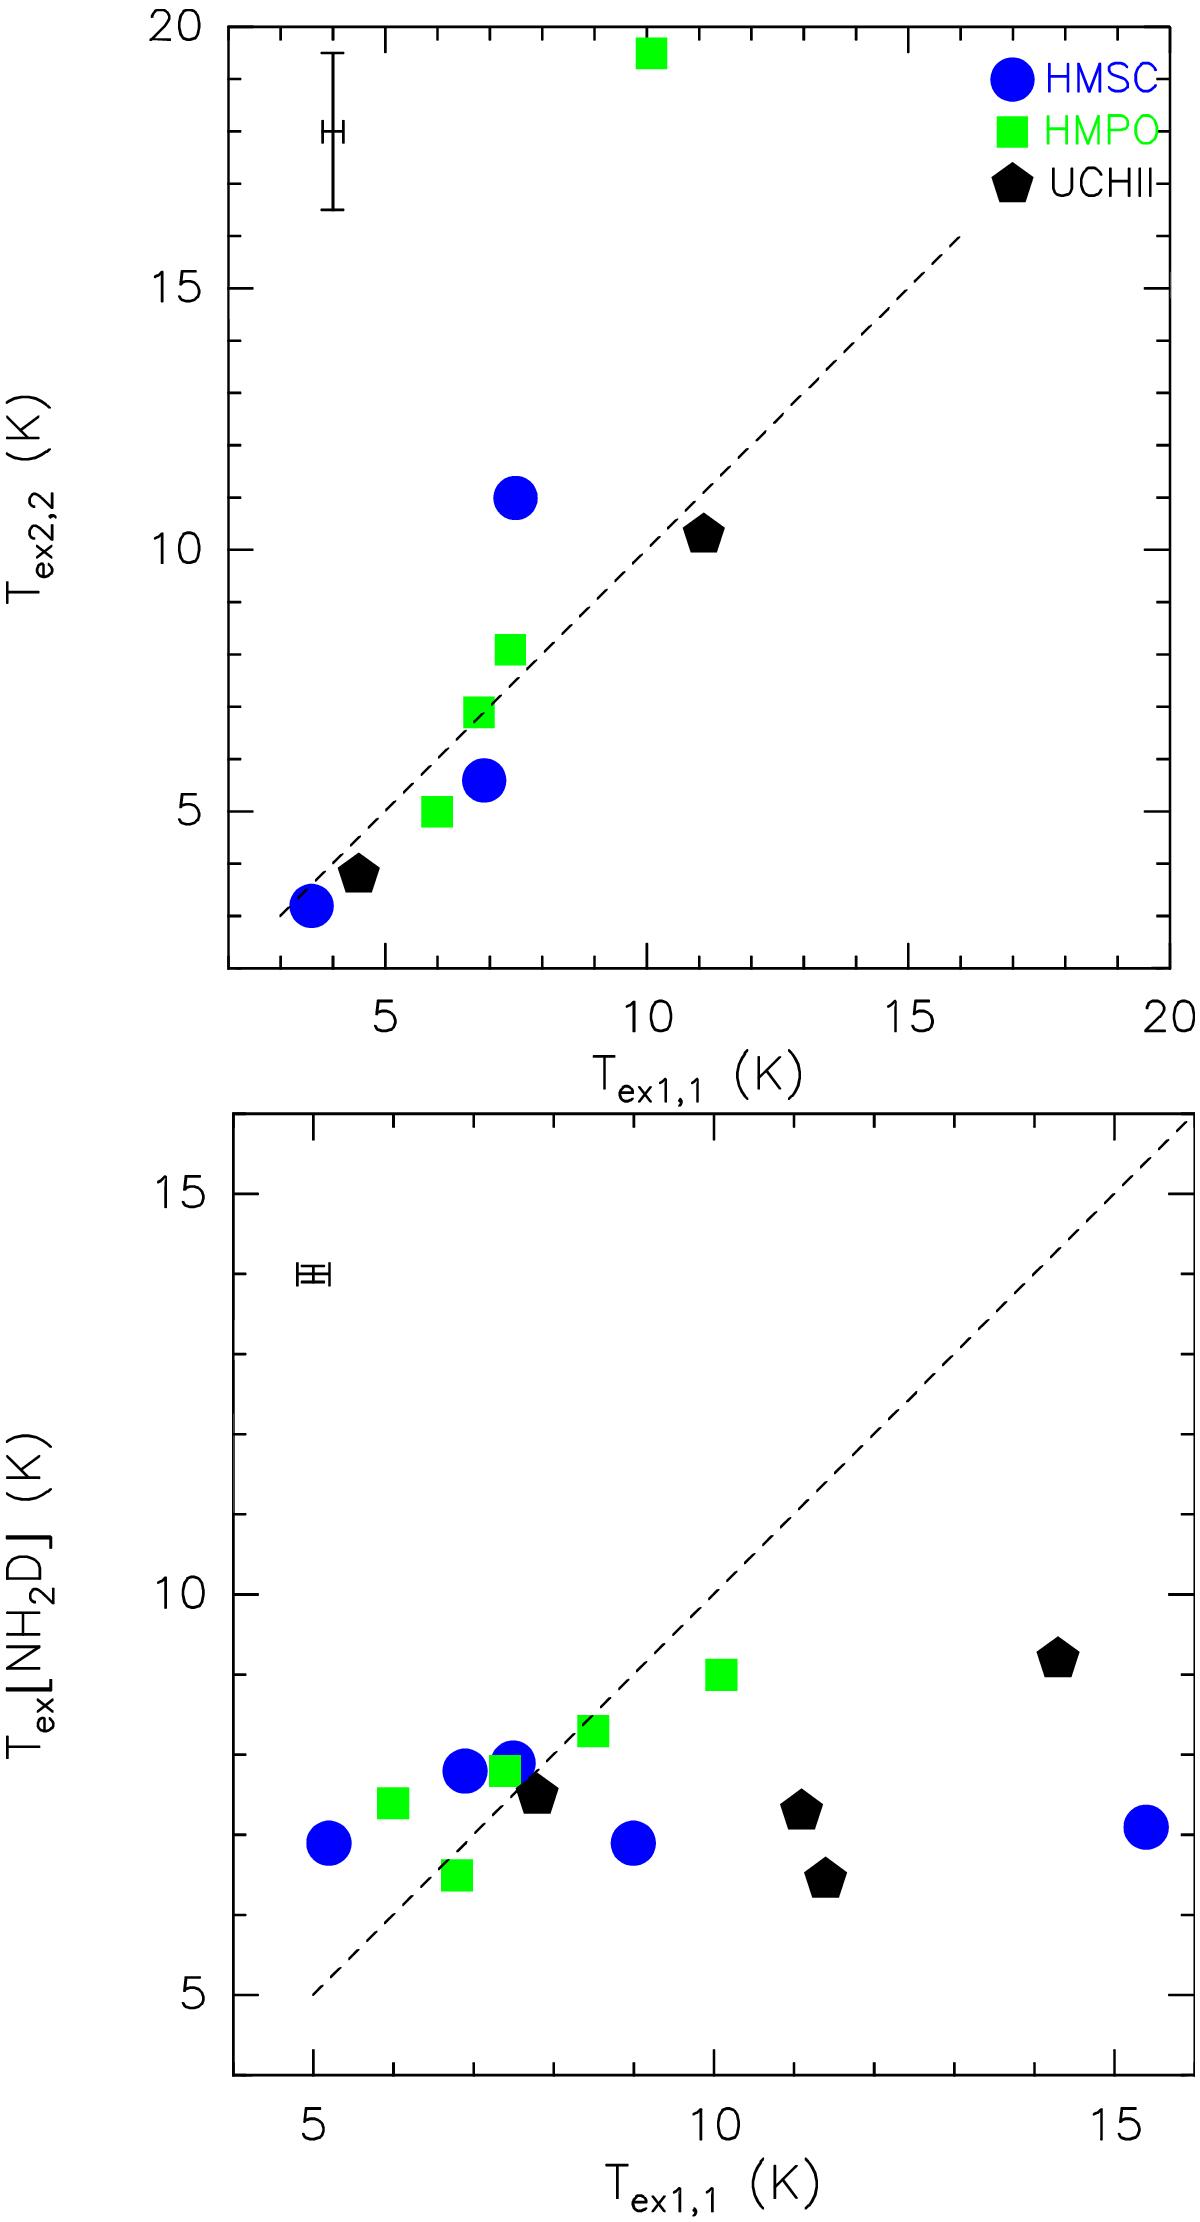
Comparison between the excitation temperatures of NH3(1,1), Tex1,1 and both Tex2,2 (upper panel) and Tex of the ortho-NH2D line (lower panel). In both panels, blue circles correspond to HMSCs, green squares show HMPOs, black pentagons correspond to UC Hii regions, and the dashed line indicates y = x. Typical error bars are indicated in the top left corner of each panel.
Current usage metrics show cumulative count of Article Views (full-text article views including HTML views, PDF and ePub downloads, according to the available data) and Abstracts Views on Vision4Press platform.
Data correspond to usage on the plateform after 2015. The current usage metrics is available 48-96 hours after online publication and is updated daily on week days.
Initial download of the metrics may take a while.