Fig. 5
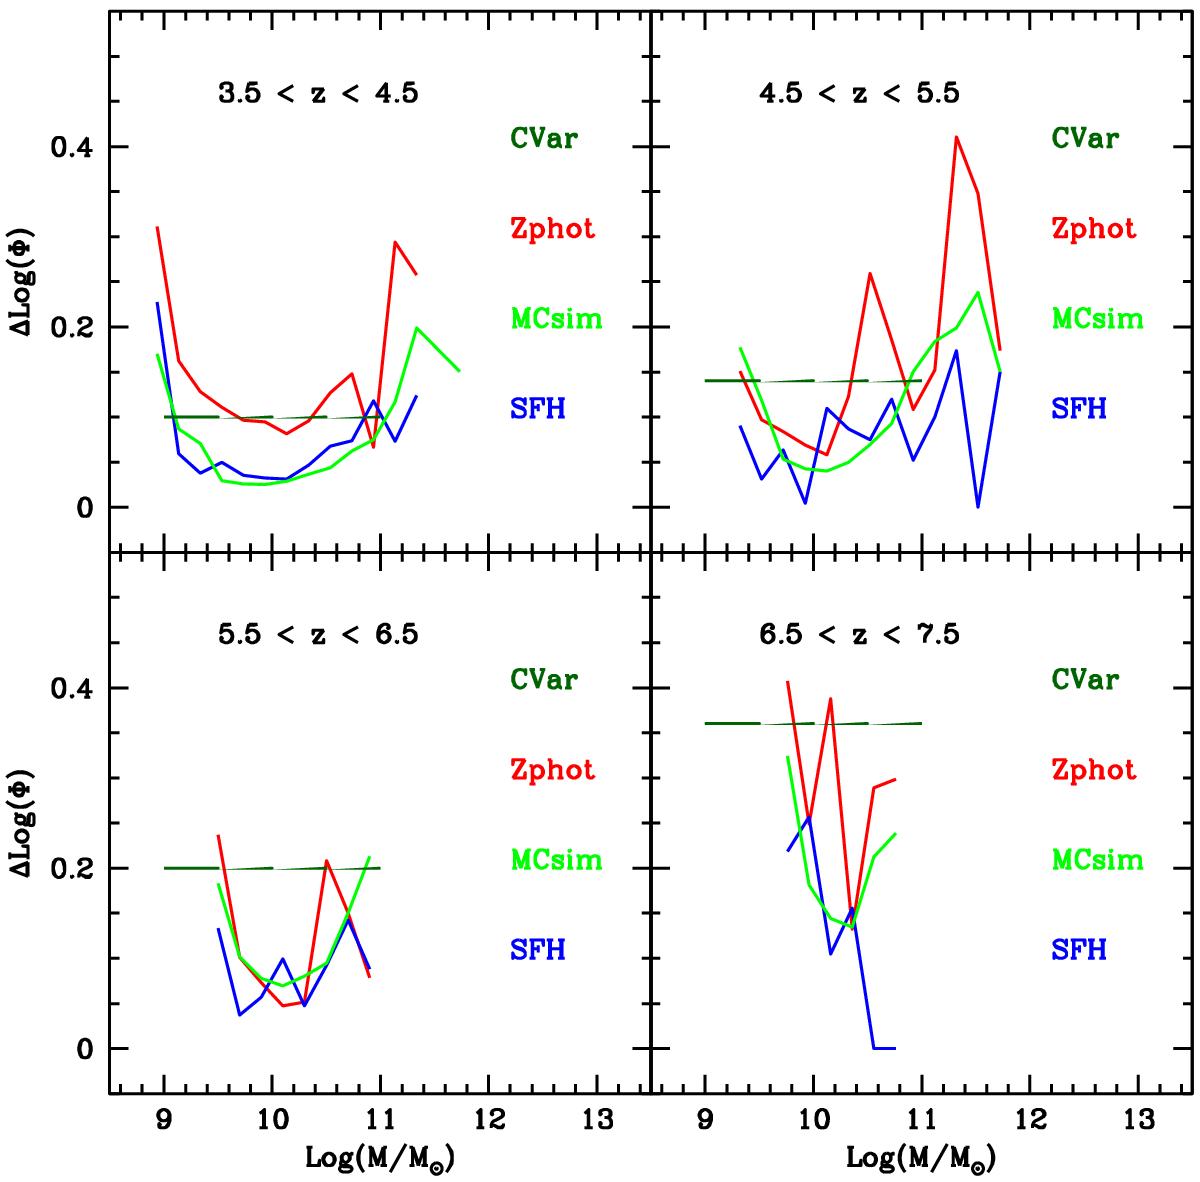
Various uncertainties in Log (Φ) as a function of stellar mass for different redshift bins from z = 4 to z = 7. Blue curves (SFH) indicate the uncertainties due to the different SFHs adopted in this work. Green curves (MCsim) are related to the Monte Carlo simulations described in paragraph 4.1. The red lines (Zphot) indicate the error introduced by different photometric-redshift solutions. Finally, the dark-green lines (CVar) indicate the error due to cosmic variance.
Current usage metrics show cumulative count of Article Views (full-text article views including HTML views, PDF and ePub downloads, according to the available data) and Abstracts Views on Vision4Press platform.
Data correspond to usage on the plateform after 2015. The current usage metrics is available 48-96 hours after online publication and is updated daily on week days.
Initial download of the metrics may take a while.