Fig. 3
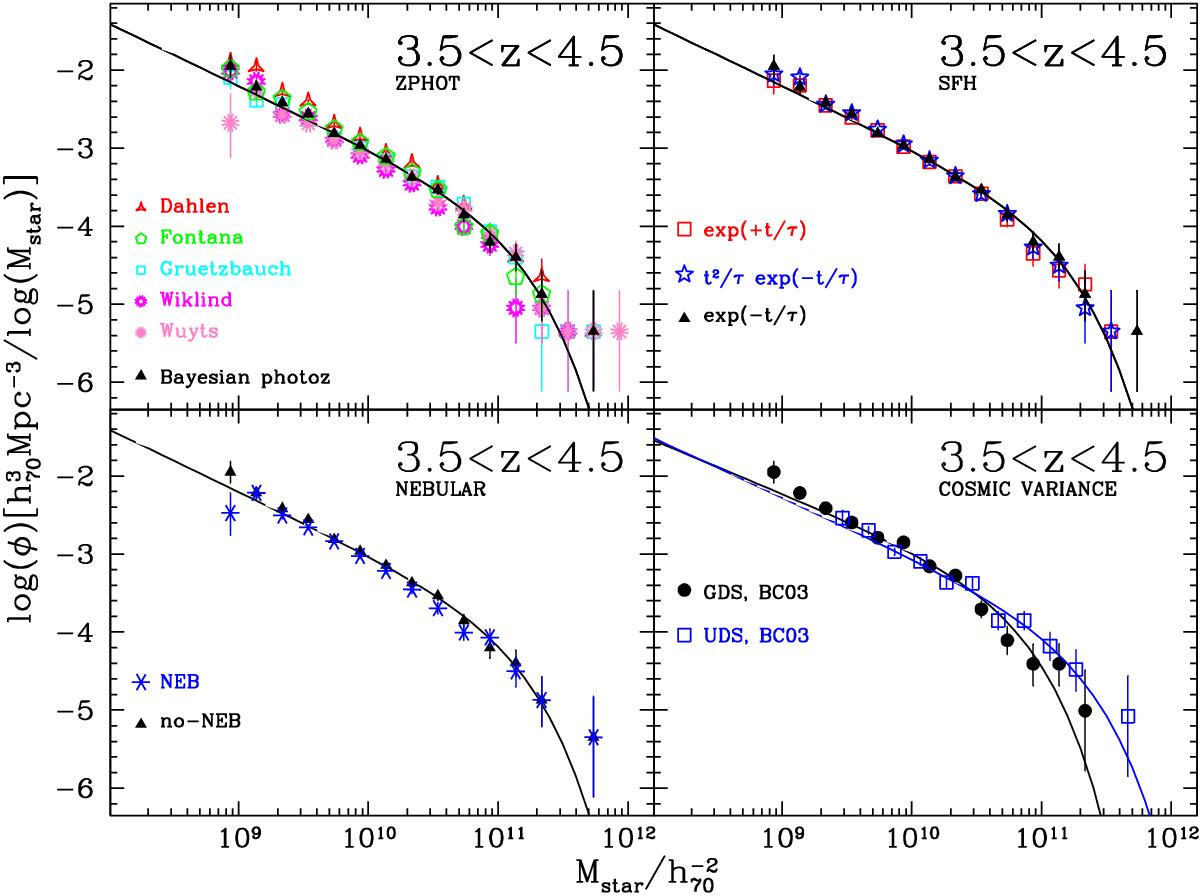
Top left: comparison of the GSMF obtained with different photometric redshift recipes. The stellar mass function of galaxies at 3.5 ≤ z ≤ 4.5 in the CANDELS GOODS-South and UDS fields derived using the Bayesian photometric redshifts is shown by the black triangles (non parametric 1/Vmax) and the solid continuous curve (parametric STY maximum likelihood). The error bars show the Poissonian uncertainties of each point. The red triangles, green stars, cyan triangles, magenta and pink asterisks show the GSMFs obtained using the individual photometric redshifts of different realizations that have been used to derive the Bayesian photo-z described in Dahlen el al. (2013). Top right: comparison of the GSMF obtained with different star formation histories. The stellar mass function of galaxies at 3.5 ≤ z ≤ 4.5 in the CANDELS GOODS-South and UDS fields assuming BC03 exponentially declining SFHs is shown by the black triangles and the solid continuous curve. The red squares and the blue stars show the GSMFs derived using exponentially increasing and a delayed SFH, respectively. All these star formation histories have been tested without the nebular contribution. Bottom left: comparison of the GSMF with and without a nebular contribution. The stellar mass function of galaxies at 3.5 ≤ z ≤ 4.5 in the CANDELS GOODS-South and UDS fields with BC03 exponentially declining SFHs and no nebular contribution is shown by the black triangles and the solid continuous curve. The blue asterisks show the GSMF derived using BC03 and exponentially declining SFHs but this time including allowance for the contribution of nebular lines and nebular continuum (NEB label). Bottom right: comparison of the GSMF in individual fields. The stellar mass function derived for galaxies at 3.5 ≤ z ≤ 4.5 in the CANDELS UDS field (empty blue squares) as compared with that derived from GOODS-South (filled black circles).
Current usage metrics show cumulative count of Article Views (full-text article views including HTML views, PDF and ePub downloads, according to the available data) and Abstracts Views on Vision4Press platform.
Data correspond to usage on the plateform after 2015. The current usage metrics is available 48-96 hours after online publication and is updated daily on week days.
Initial download of the metrics may take a while.