Fig. C.3
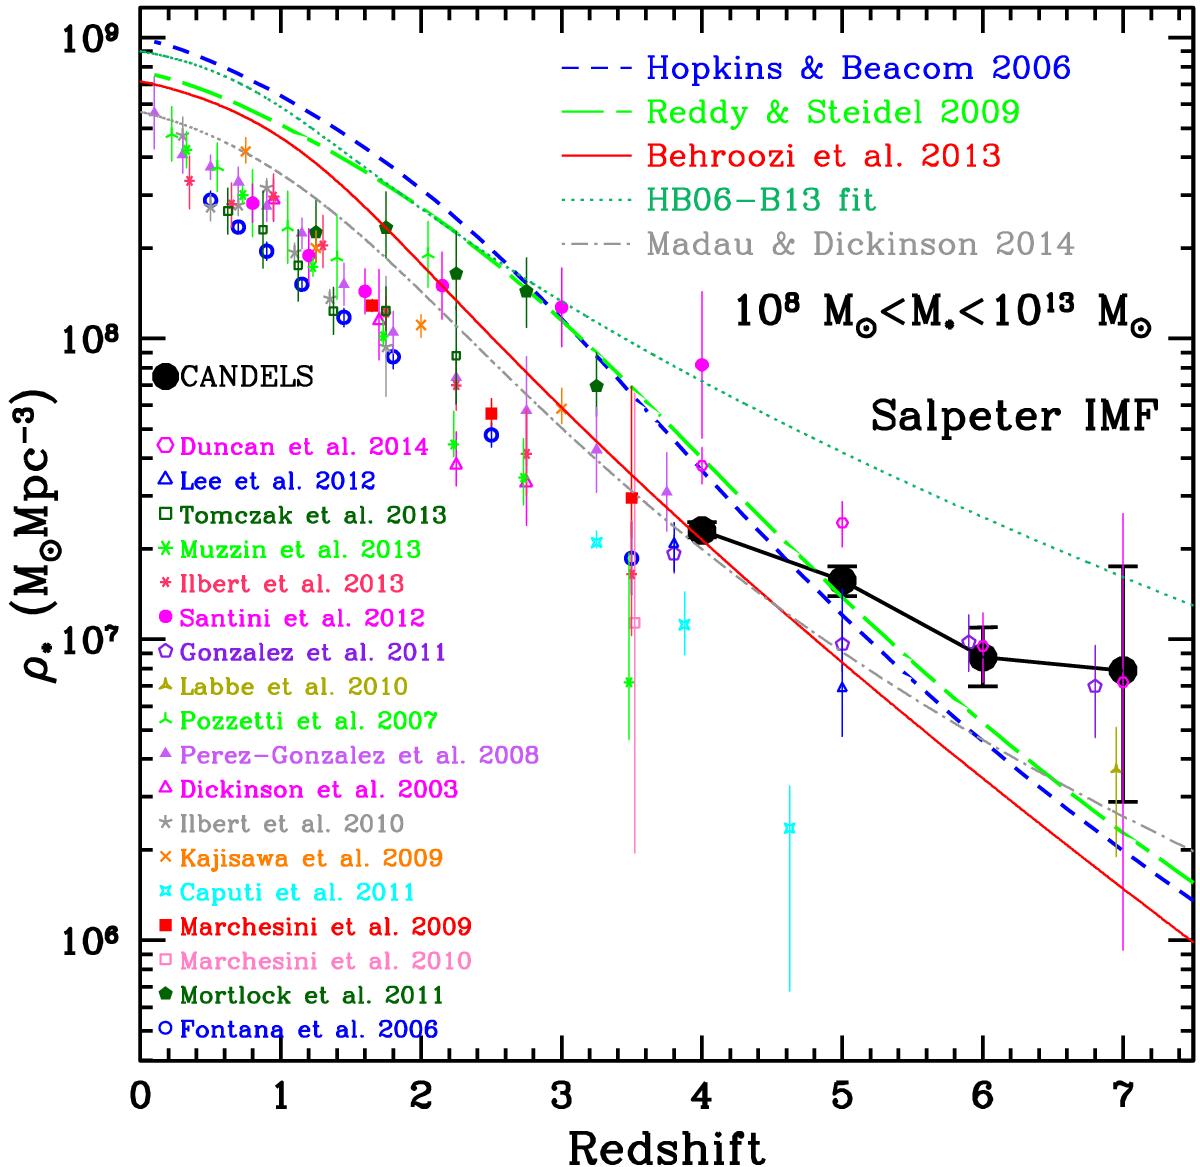
Redshift evolution of the stellar mass density (SMD) at 3.5 <z< 7.5 obtained in the CANDELS UDS and GOODS-South fields presented in this paper (black points), when the effect of uncertainties in the stellar mass (the so-called Eddington bias) are not taken into account. The SMD is compared to the lower redshift data from different surveys. ρM is in units of M⊙ Mpc-3 and has been obtained by integrating the best fit mass functions from Mmin = 108 M⊙ to Mmax = 1013 M⊙. All the SMDs have been converted to a Salpeter IMF for comparison. The error bars of the CANDELS data have been computed using the same Monte Carlo simulations developed to derive the uncertainties on the Schechter function parameters. The short-dashed line is the stellar mass density obtained integrating over cosmic time the star formation rate density (SFRD) of Hopkins & Beacom (2006). The long-dashed line is the SMD from the SFRD of Reddy & Steidel (2009). The solid line is the SMD obtained by integrating the SFRD of Behroozi et al. (2013), while the dotted line is the SMD derived by integrating the new fit of the Hopkins & Beacom (2006) carried out by Behroozi et al. (2013). The dotted-dashed line shows the SMD derived from the SFRD given by of Madau & Dickinson (2014). All the stellar mass densities obtained by integrating the different SFRDs assume a constant recycling fraction of 28%.
Current usage metrics show cumulative count of Article Views (full-text article views including HTML views, PDF and ePub downloads, according to the available data) and Abstracts Views on Vision4Press platform.
Data correspond to usage on the plateform after 2015. The current usage metrics is available 48-96 hours after online publication and is updated daily on week days.
Initial download of the metrics may take a while.