Free Access
Fig. B.3
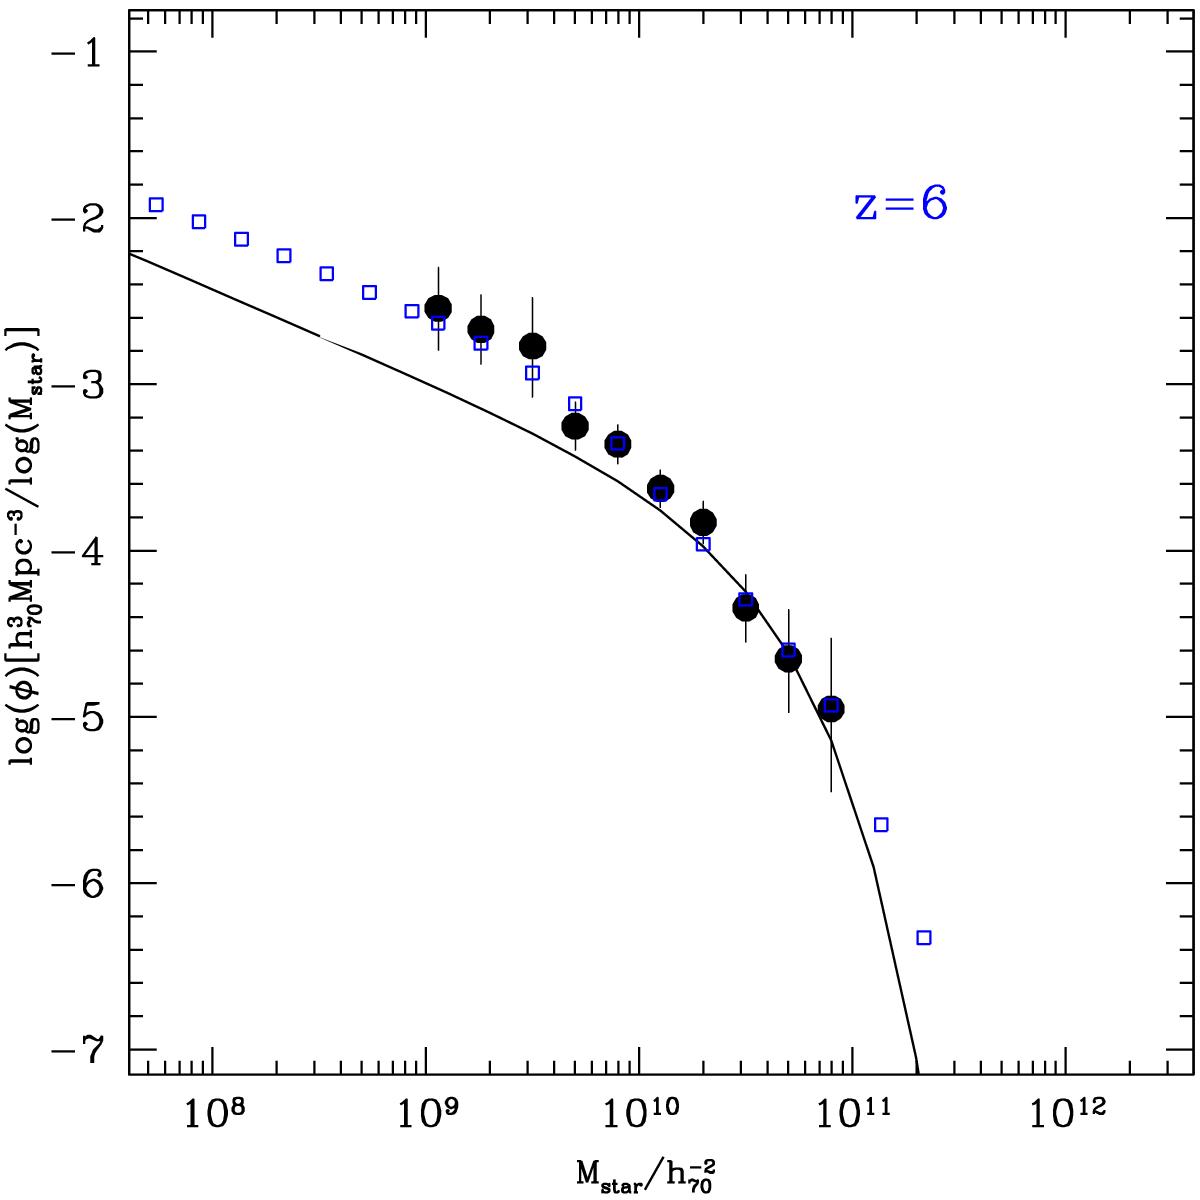
Effect of the Eddington bias on the observed GSMF at z = 6 (black dots). The black line shows a Schechter function representing the resulting best fit GSMF at z = 6. The open blue squares show the resulting GSMF after convolution with the observed PDFs at z = 6 (Fig. B.1, bottom panel).
Current usage metrics show cumulative count of Article Views (full-text article views including HTML views, PDF and ePub downloads, according to the available data) and Abstracts Views on Vision4Press platform.
Data correspond to usage on the plateform after 2015. The current usage metrics is available 48-96 hours after online publication and is updated daily on week days.
Initial download of the metrics may take a while.