Fig. B.2
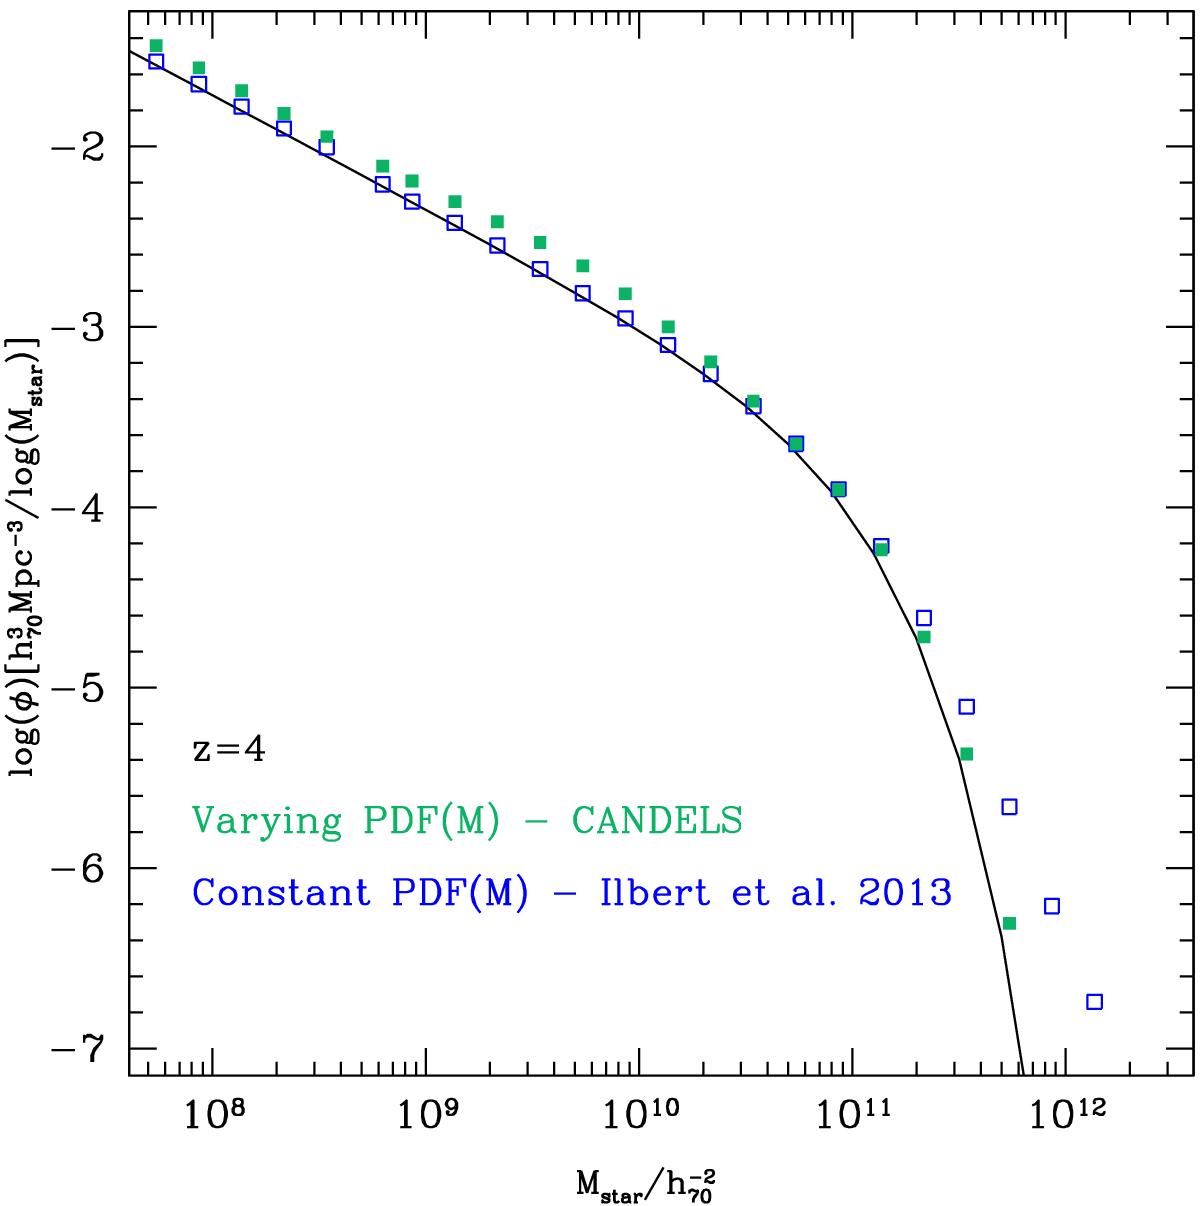
Effect of different prescription of the Eddington bias on the observed GSMF. The black line shows a Schechter function representing a GSMF with α ≃ − 1.6 and M∗ ≃ 11. The open blue squares show the resulting GSMF in bins of 0.2 in log M after convolution with a constant PDF at all masses, as adopted by Ilbert et al. (2013) at z = 4. The green filled squares represent the GSMF after convolution with the more realistic mass-dependent PDF that widens when mass decreases as we find in CANDELS (Fig. B.1).
Current usage metrics show cumulative count of Article Views (full-text article views including HTML views, PDF and ePub downloads, according to the available data) and Abstracts Views on Vision4Press platform.
Data correspond to usage on the plateform after 2015. The current usage metrics is available 48-96 hours after online publication and is updated daily on week days.
Initial download of the metrics may take a while.