Fig. B.1
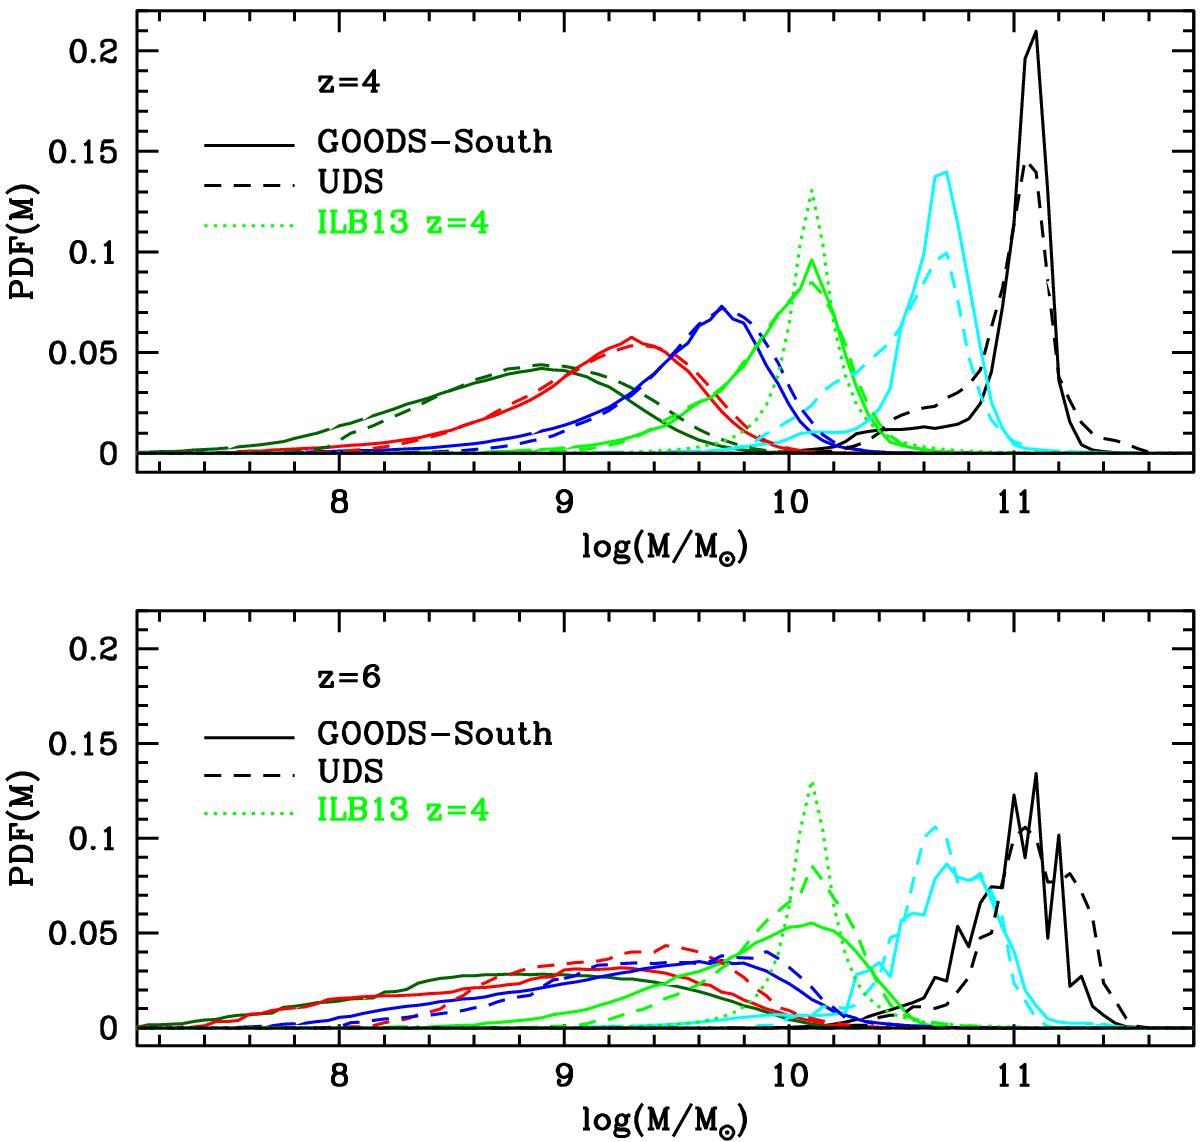
Probability distribution functions (PDFs) of stellar mass for galaxies with measured stellar mass M at different masses and redshifts, resulting from the Monte Carlo simulations described in the text. The PDFs were averaged over all galaxies contained in contiguous bins with separation in mass of 0.2 in log (M), although we plot here only a few examples. The upper panel presents the PDFs at z = 4 ± 0.5, the lower panel at z = 6 ± 0.5. In both panels the dark-green curves are associated with galaxies in the bin centred at log (M/M⊙) = 8.9, while red, blue, green, cyan, and black curves are associated with galaxies with masses log (M/M⊙) of 9.3, 9.7, 10.1, 10.7 and 11.1 respectively. Solid lines refer to GOODS-South, dashed to UDS. The dotted green line shows for comparison the PDF adopted at all masses by Ilbert et al. (2013) at z = 4.
Current usage metrics show cumulative count of Article Views (full-text article views including HTML views, PDF and ePub downloads, according to the available data) and Abstracts Views on Vision4Press platform.
Data correspond to usage on the plateform after 2015. The current usage metrics is available 48-96 hours after online publication and is updated daily on week days.
Initial download of the metrics may take a while.