Fig. 10
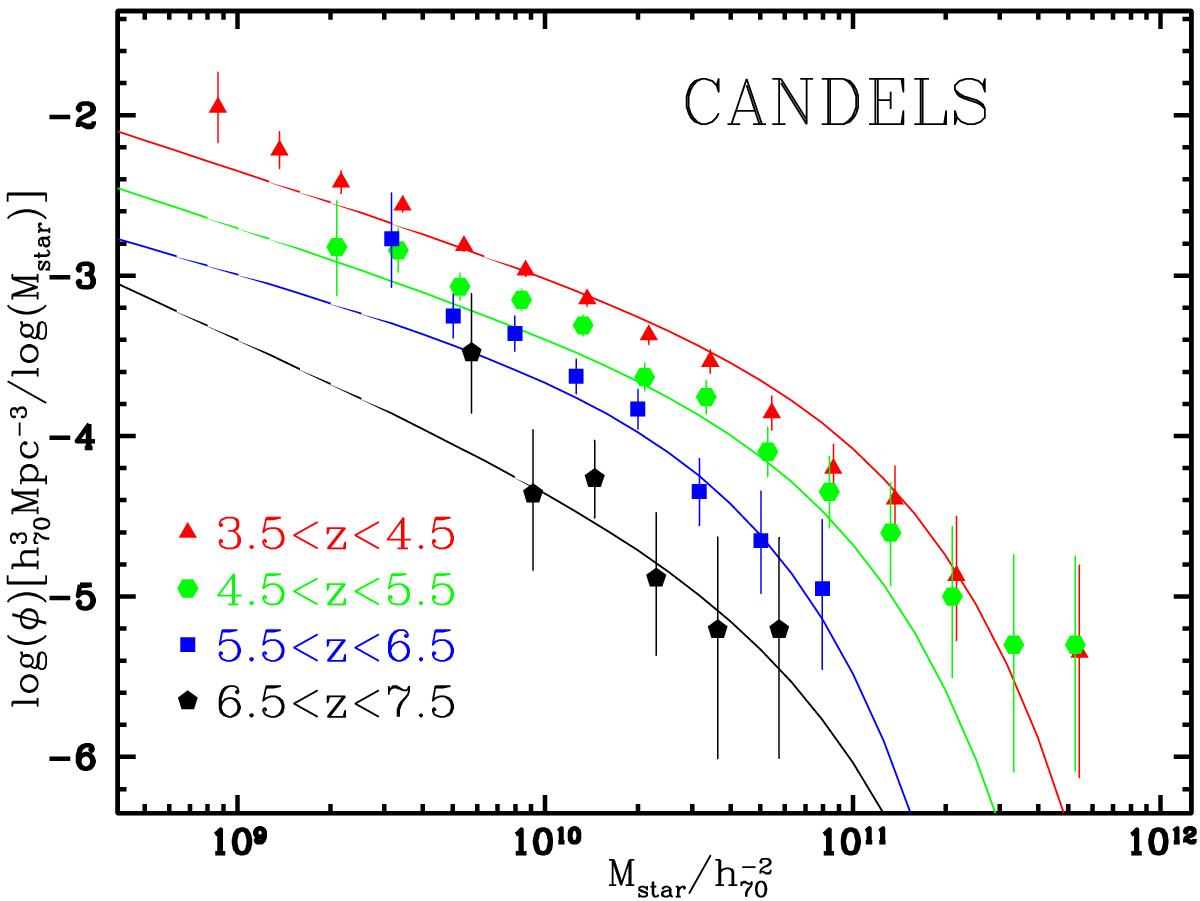
GSMFs from z = 4 to z = 7 in the CANDELS UDS and GOODS-South fields. The error bars take into account the Poissonian statistics, the cosmic variance and the uncertainties derived through the Monte Carlo simulations. The solid continuous curves show the Schechter function derived through a best-fit approach which corrects the observed data points for the Eddington bias.
Current usage metrics show cumulative count of Article Views (full-text article views including HTML views, PDF and ePub downloads, according to the available data) and Abstracts Views on Vision4Press platform.
Data correspond to usage on the plateform after 2015. The current usage metrics is available 48-96 hours after online publication and is updated daily on week days.
Initial download of the metrics may take a while.