Fig. 1
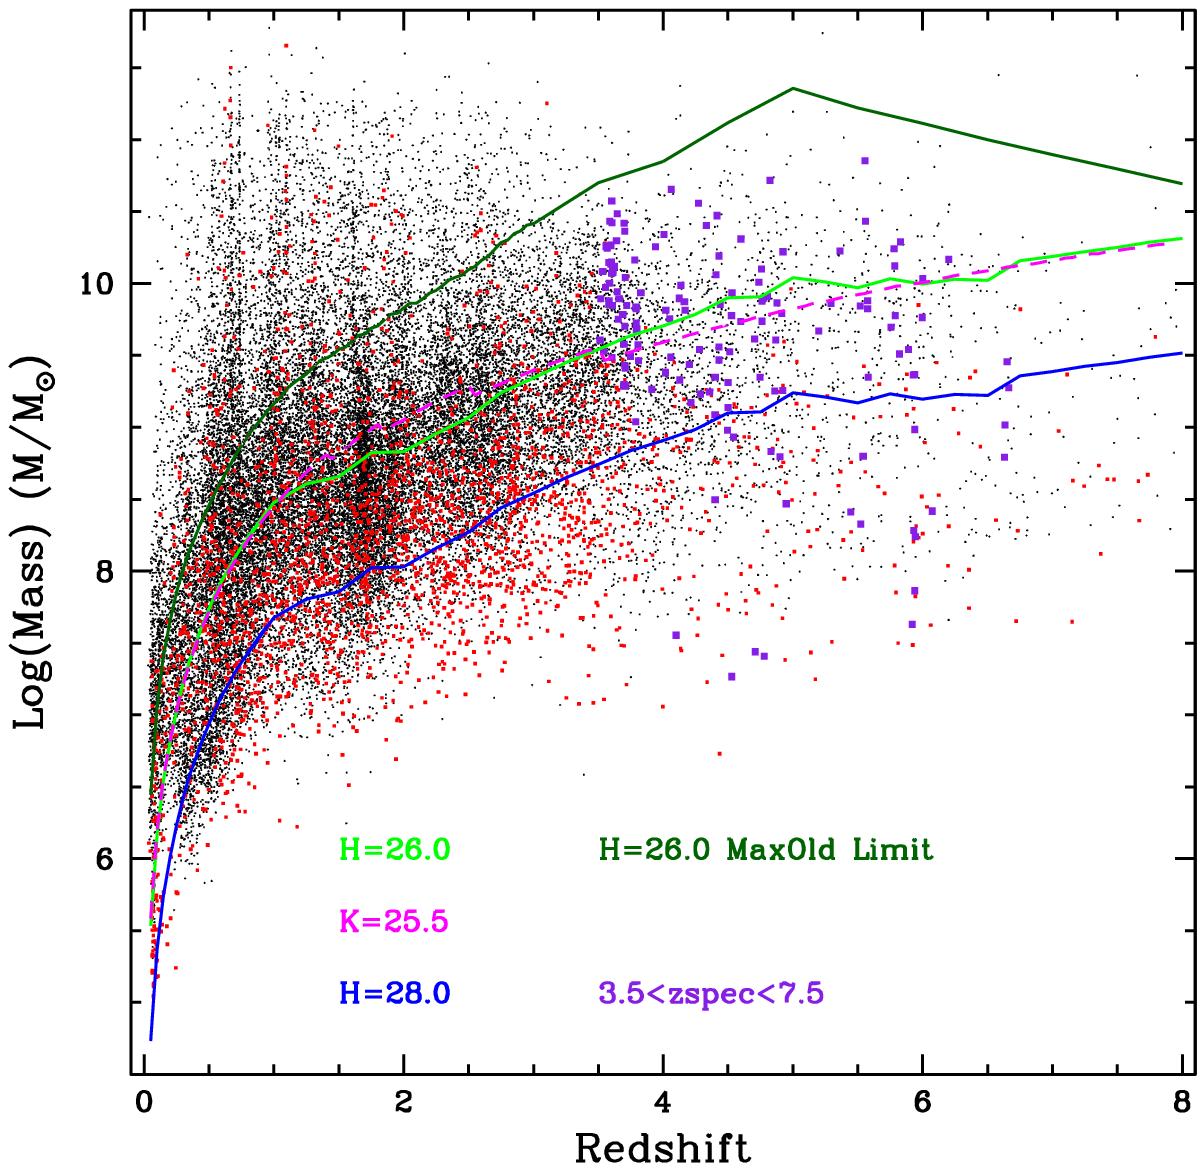
Black dots: all the galaxies in the CANDELS GOODS-South field; red dots: galaxies in the deepest region (HUDF). The purple big squares indicate galaxies with robust spectroscopic redshift in the range 3.5 ≤ z ≤ 7.5. The strict completeness mass vs. redshift for a magnitude limit of H160 = 26.0 (dark green). This curve has been derived from the maximally old galaxies in our synthetic library, corresponding to a formation redshift zform = 20, an E(B − V) = 0.1, metallicity of 0.2 Z⊙ and a declining SFH with timescale τ = 0.1 Gyr. The light-green curve shows the completeness-corrected limit corresponding to the shallower pointings in the GOODS-South and UDS fields (H160 = 26.0), while the blue curve represents the corresponding limit for our deepest area, the HUDF field (H160 = 28.0), once the mass limit has been extended taking into account the suitable correction for the M∗/L distribution. For comparison, the magenta curve (dashed) is the completeness limit in mass in the ERS field derived by Santini et al. (2012a) which corresponds to K = 25.5.
Current usage metrics show cumulative count of Article Views (full-text article views including HTML views, PDF and ePub downloads, according to the available data) and Abstracts Views on Vision4Press platform.
Data correspond to usage on the plateform after 2015. The current usage metrics is available 48-96 hours after online publication and is updated daily on week days.
Initial download of the metrics may take a while.