Fig. 9
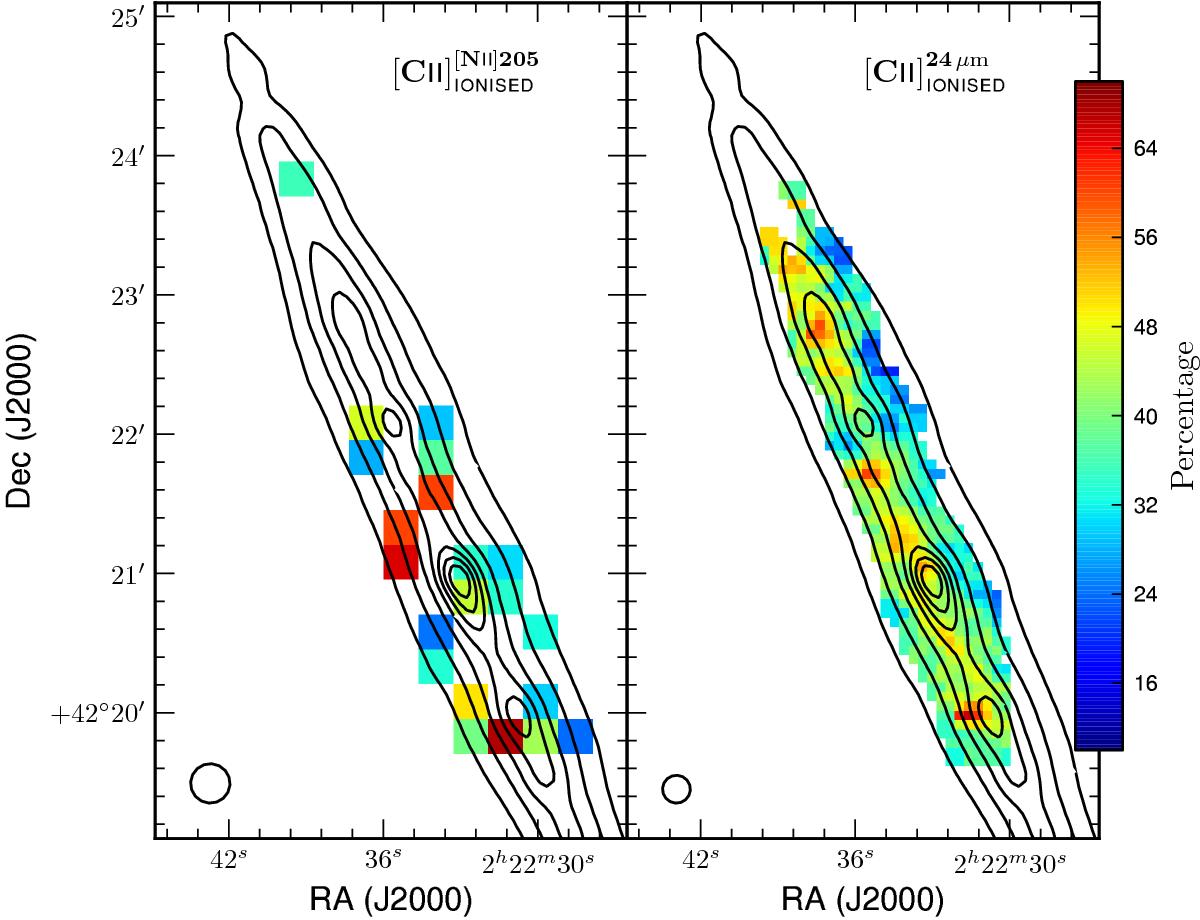
Comparison of the fraction of the [Cii] emission originating from ionised
gas as determined from the observed map of the [Nii] 205 μm line emission at
17″ resolution
(left panel), and that as determined from a synthetic map of the
[Nii] 205 μm line emission estimated using the 24
μm
emission at 12″
resolution (right panel) via the correlation presented in Fig. 8.
The maps are centred on ![]() ,
,
![]() (J2000.0) and the black contours
from the FTIR map (see Fig. 1) represent TIR flux levels as listed in the
caption of Fig. 4.
(J2000.0) and the black contours
from the FTIR map (see Fig. 1) represent TIR flux levels as listed in the
caption of Fig. 4.
Current usage metrics show cumulative count of Article Views (full-text article views including HTML views, PDF and ePub downloads, according to the available data) and Abstracts Views on Vision4Press platform.
Data correspond to usage on the plateform after 2015. The current usage metrics is available 48-96 hours after online publication and is updated daily on week days.
Initial download of the metrics may take a while.