Fig. 8
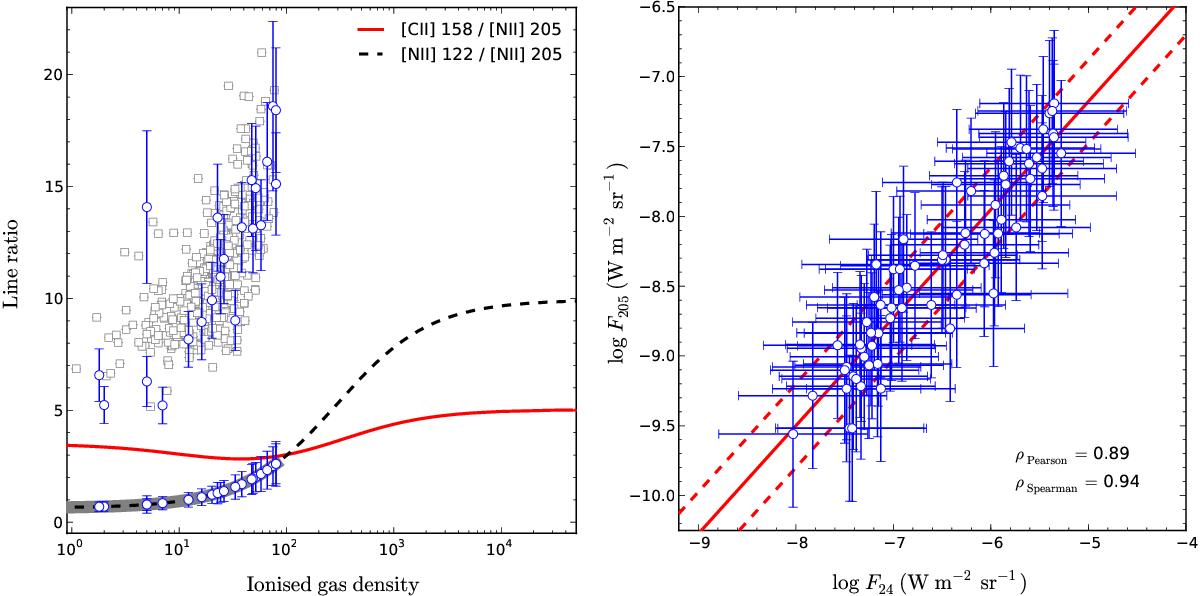
Left: theoretical line ratios for the [Cii] 158, [Nii] 122 and 205 μm transitions from diffuse ionised gas, plotted as a function of the hydrogen density. We interpolate the ionised gas density from the observed [Nii] 122/[Nii] 205 ratio (blue circles following the black dashed line), which is subsequently used to determine the theoretical [Cii] 158/[Nii] 205 emission for comparison with the observed [Cii]158/[Nii]205 emission (open blue circles), and hence calculate the fraction of [Cii] emission attributed to PDRs. The synthetic [Nii] 122 / [Nii] 205 line ratios (occupying the grey shaded region) estimated via a correlation with the MIPS 24 μm emission (see the right hand panel) are used to interpolate the ionised gas density to compare with the estimated [Cii] 158/[Nii] 205 ratio (open grey squares). Right: correlation between the MIPS 24 μm emission and the [Nii] 205 μm emission. The best linear fit including 1σ limits are represented by the solid and dashed red lines, respectively. In both panels, each data point represents one pixel.
Current usage metrics show cumulative count of Article Views (full-text article views including HTML views, PDF and ePub downloads, according to the available data) and Abstracts Views on Vision4Press platform.
Data correspond to usage on the plateform after 2015. The current usage metrics is available 48-96 hours after online publication and is updated daily on week days.
Initial download of the metrics may take a while.