Fig. 7
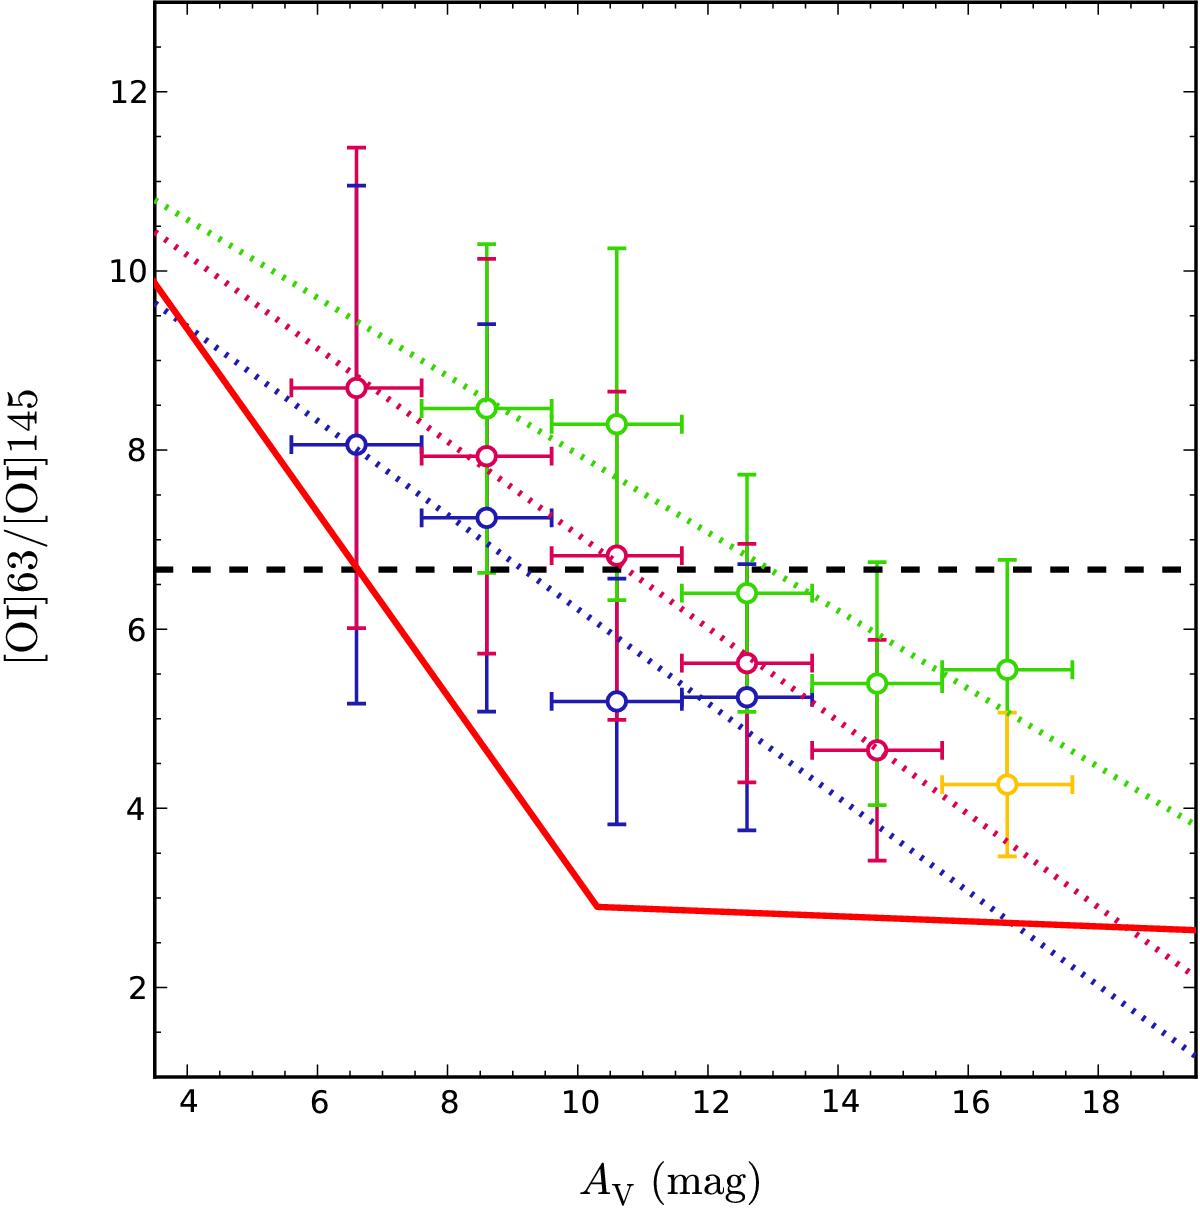
[Oi]63/[Oi]145 line ratio plotted as a function of the attenuation. We distinguish the median line ratio derived for pixels from different regions of the disc in AV bins with widths of 2 mag (open circles) according to the colour scheme as depicted in Fig. 2, and plot the corresponding best linear fits to the binned data (coloured dotted lines). We note the limited coverage of the [Oi] 145 μm map means these colours correspond mainly to varying vertical height from the mid-plane of the disc. The black dashed line corresponds to the ratio that approximately divides the optically thin and optically thick regime as in Fig. 4 of Liseau et al. (2006), and the red solid line demonstrates the [Oi]63/[Oi]145 – AV relationship predicted by the PDR model of Abel et al. (2007, see their Fig. 3).
Current usage metrics show cumulative count of Article Views (full-text article views including HTML views, PDF and ePub downloads, according to the available data) and Abstracts Views on Vision4Press platform.
Data correspond to usage on the plateform after 2015. The current usage metrics is available 48-96 hours after online publication and is updated daily on week days.
Initial download of the metrics may take a while.