Fig. 5
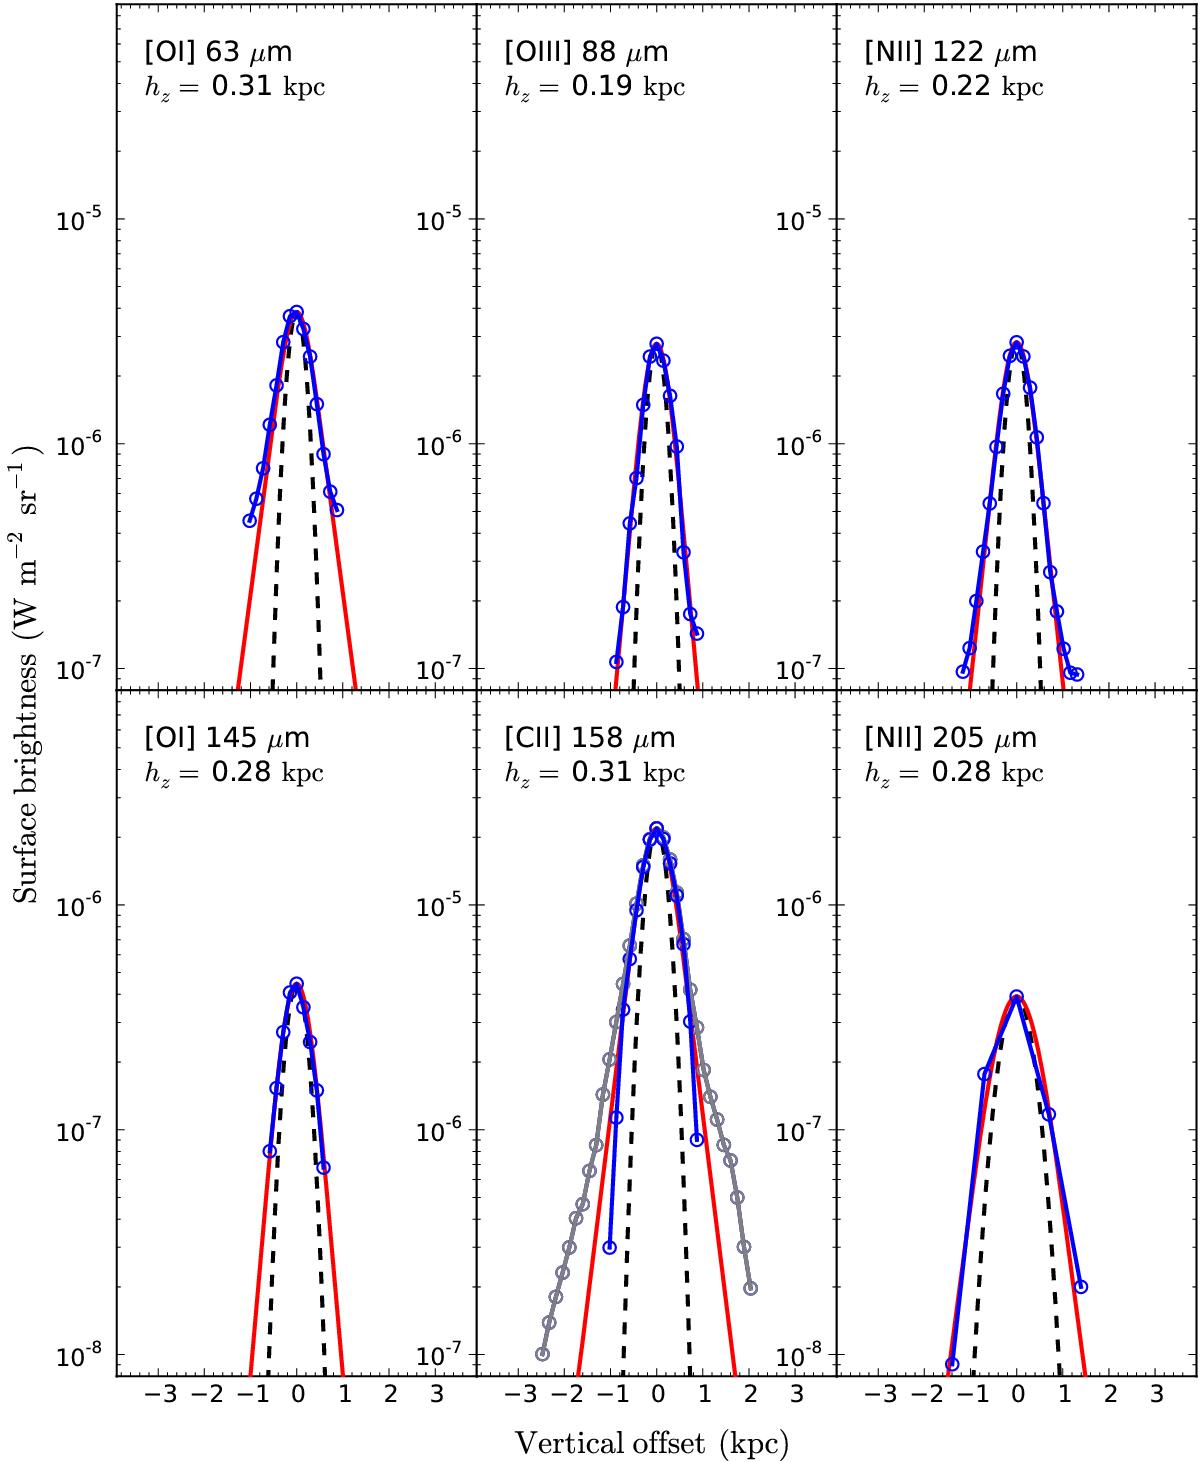
Vertical profiles from the emission maps (S/N> 3σ) of the [Cii] 158 μm, [Nii] 122 and 205 μm, [Oi] 63 and 145 μm, and [Oiii] 88 μm fine-structure lines are plotted as blue circles connected by a blue line. We fit with an exponential profile (solid red line), which has been convolved with a Gaussian of FWHM similar to the Herschel beam at the corresponding wavelength (black dashed line). For the [Cii] profile, we also show the profile including the extraplanar emission detected at the >1σ level (grey circles and grey line).
Current usage metrics show cumulative count of Article Views (full-text article views including HTML views, PDF and ePub downloads, according to the available data) and Abstracts Views on Vision4Press platform.
Data correspond to usage on the plateform after 2015. The current usage metrics is available 48-96 hours after online publication and is updated daily on week days.
Initial download of the metrics may take a while.