Fig. 4
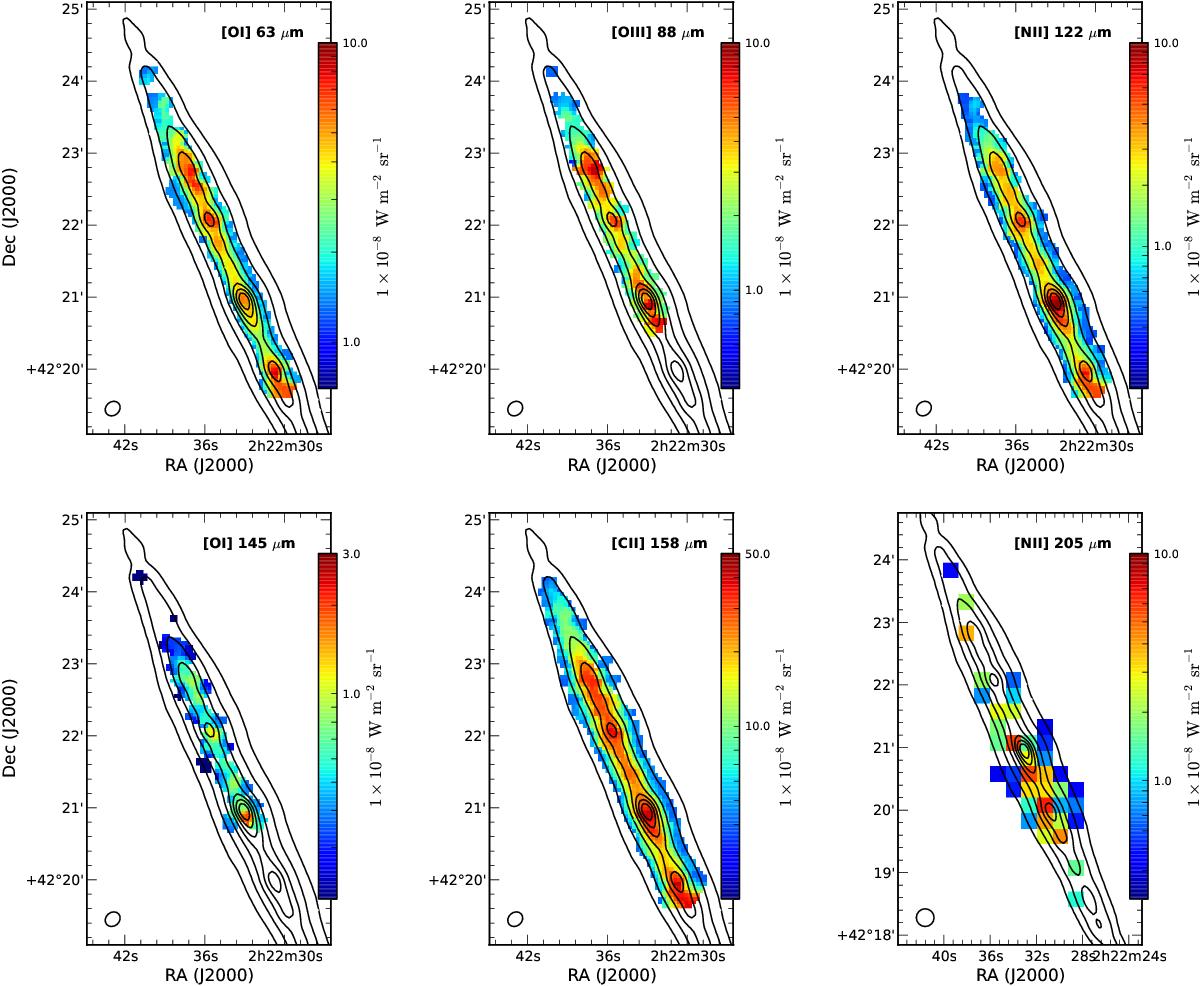
Herschel PACS and SPIRE spectroscopic maps of the most important
FIR cooling lines in NGC 891: [Oi] λ 63 μm (upper
left), and [Oiii] λ 88 μm (upper
middle), [Nii] λ 122 μm (upper
right), [Oi] λ 145 μm (lower
left), [Cii] λ 158 μm (lower
middle), and [Nii] λ 205 μm (lower
right). The maps are centred on ![]() ,
,
![]() (J2000.0), except for the
[Nii] 205 μm image that is centred as in Fig. 1, and are presented in their native resolution and
pixel size. We only show pixels with S/N> 3σ,
yet note that only raster strips are available for the [Oiii]
λ 88
and [Oi] λ 145 μm line emission.
Contours from the FTIR map (see Fig. 1) are superimposed on each image as a visual aid,
with the levels corresponding to 4 ×
10-6, 1 ×
10-5, 2.5
× 10-5, 5 ×
10-5, 7.5
× 10-5, 1 ×
10-4, and 1.25 × 10⁻⁴W m-2 sr-1. North is up, east is to the
left.
(J2000.0), except for the
[Nii] 205 μm image that is centred as in Fig. 1, and are presented in their native resolution and
pixel size. We only show pixels with S/N> 3σ,
yet note that only raster strips are available for the [Oiii]
λ 88
and [Oi] λ 145 μm line emission.
Contours from the FTIR map (see Fig. 1) are superimposed on each image as a visual aid,
with the levels corresponding to 4 ×
10-6, 1 ×
10-5, 2.5
× 10-5, 5 ×
10-5, 7.5
× 10-5, 1 ×
10-4, and 1.25 × 10⁻⁴W m-2 sr-1. North is up, east is to the
left.
Current usage metrics show cumulative count of Article Views (full-text article views including HTML views, PDF and ePub downloads, according to the available data) and Abstracts Views on Vision4Press platform.
Data correspond to usage on the plateform after 2015. The current usage metrics is available 48-96 hours after online publication and is updated daily on week days.
Initial download of the metrics may take a while.