Fig. 3
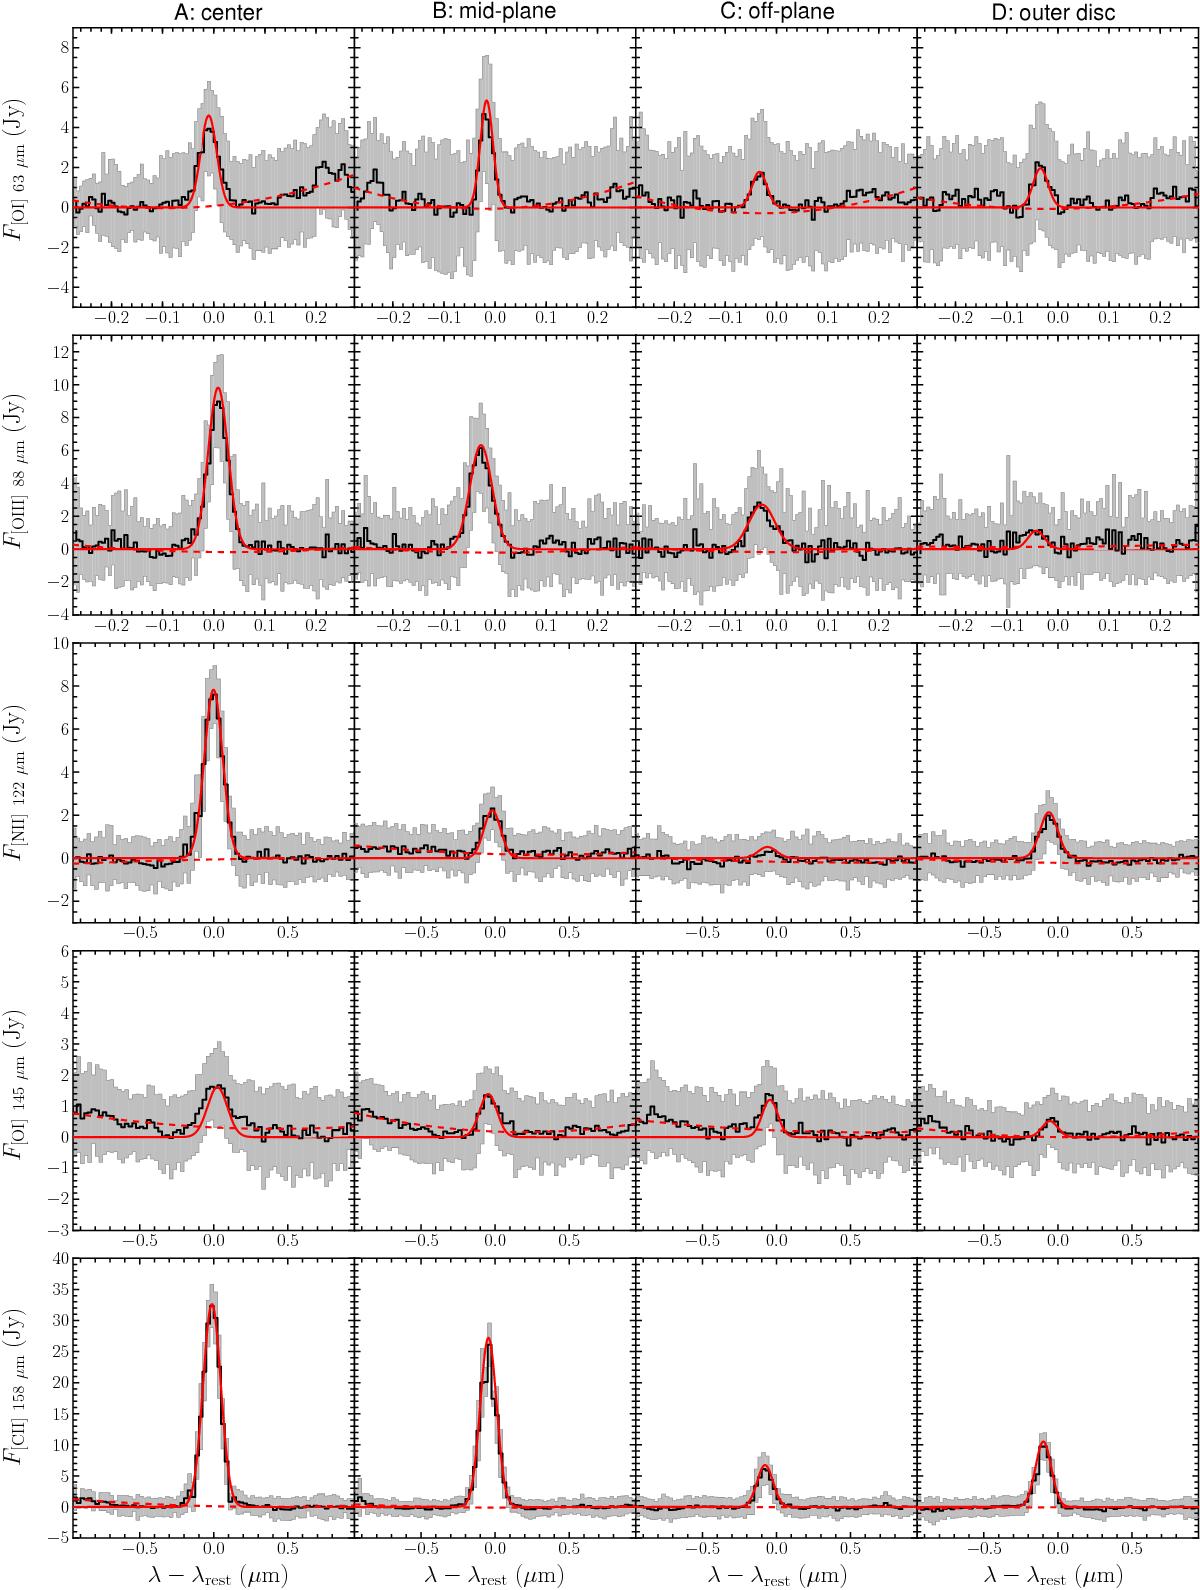
[Oi] 63, [Oiii] 88, [Nii] 122, [Oi] 145, and [Cii] 158 μm line spectra (top to bottom) found in locations A-D (see Fig. 2) representative of the central, mid-plane, off-plane and outer regions (left to right). We plot the rms after 5σ clipping (black line) and corresponding ±1σ values in each bin (grey area), and our best fit Gaussian profile and baseline (solid and dashed red lines).
Current usage metrics show cumulative count of Article Views (full-text article views including HTML views, PDF and ePub downloads, according to the available data) and Abstracts Views on Vision4Press platform.
Data correspond to usage on the plateform after 2015. The current usage metrics is available 48-96 hours after online publication and is updated daily on week days.
Initial download of the metrics may take a while.