Fig. 15
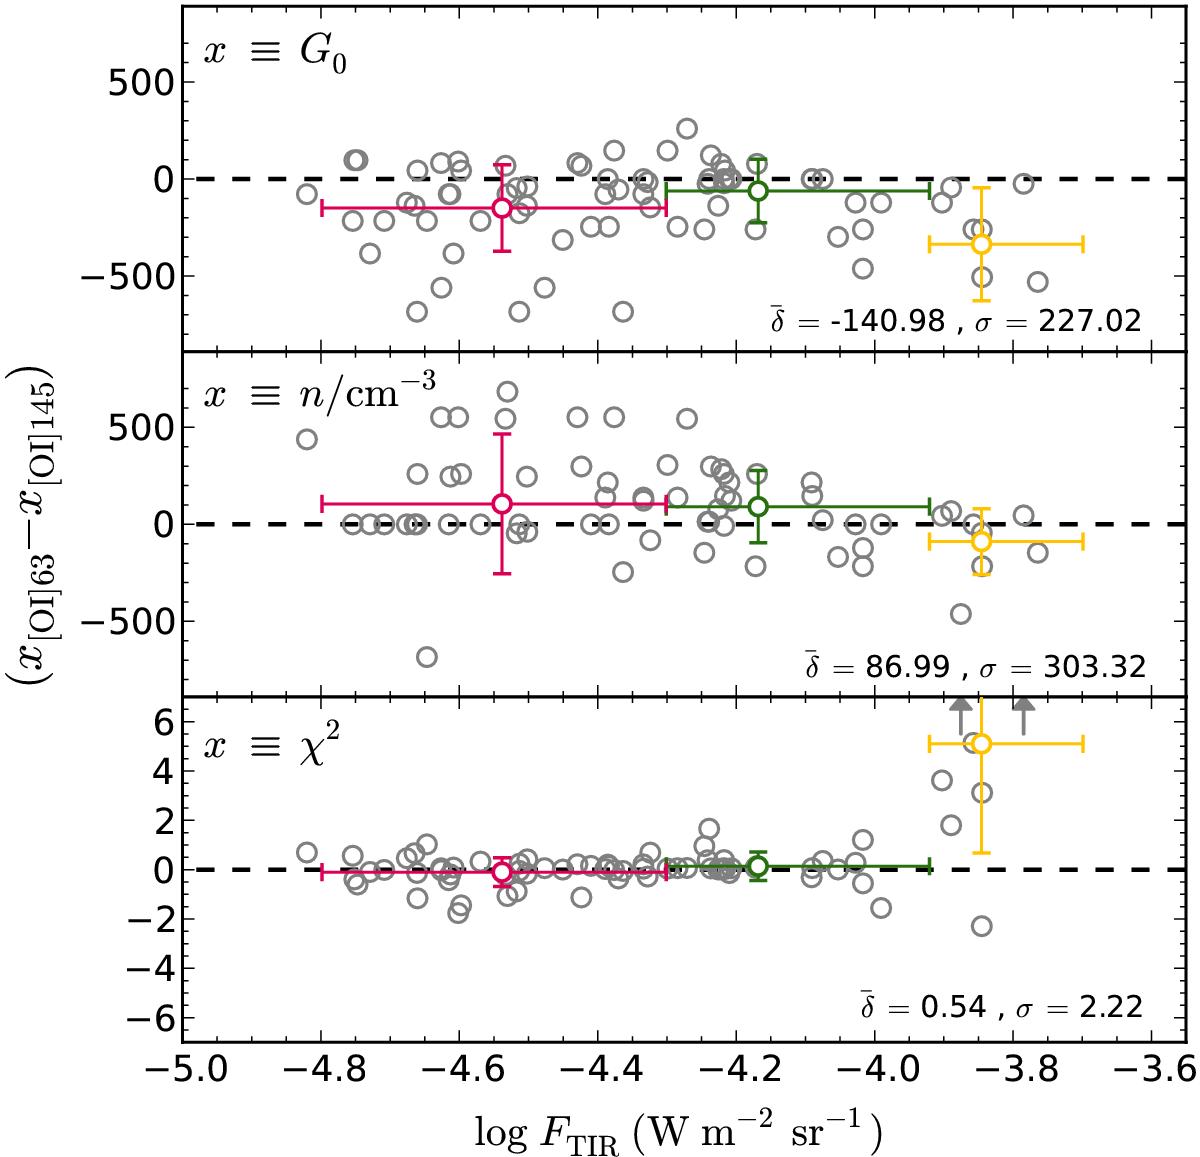
Comparison of the FUV radiation field strength, G0
(upper panel), hydrogen nuclei density, n (middle
panel), and the χ2 value (lower
panel) from fitting the Kaufman et al.
(1999, 2006) PDR model to the
[Cii] and FTIR emission together with either
the [Oi] 63 or 145 μm line emission, adjusted via the
![]() -based correction. The difference
between the parameters are plotted against the logarithm of the TIR emission, and
the coloured bins correspond to the schematic in Fig. 2. The quoted values are the overall scatter (σ) defined as the
standard deviation of the difference (δ) between the PDR model parameters
constrained with each [Oi] line.
-based correction. The difference
between the parameters are plotted against the logarithm of the TIR emission, and
the coloured bins correspond to the schematic in Fig. 2. The quoted values are the overall scatter (σ) defined as the
standard deviation of the difference (δ) between the PDR model parameters
constrained with each [Oi] line.
Current usage metrics show cumulative count of Article Views (full-text article views including HTML views, PDF and ePub downloads, according to the available data) and Abstracts Views on Vision4Press platform.
Data correspond to usage on the plateform after 2015. The current usage metrics is available 48-96 hours after online publication and is updated daily on week days.
Initial download of the metrics may take a while.