Fig. 13
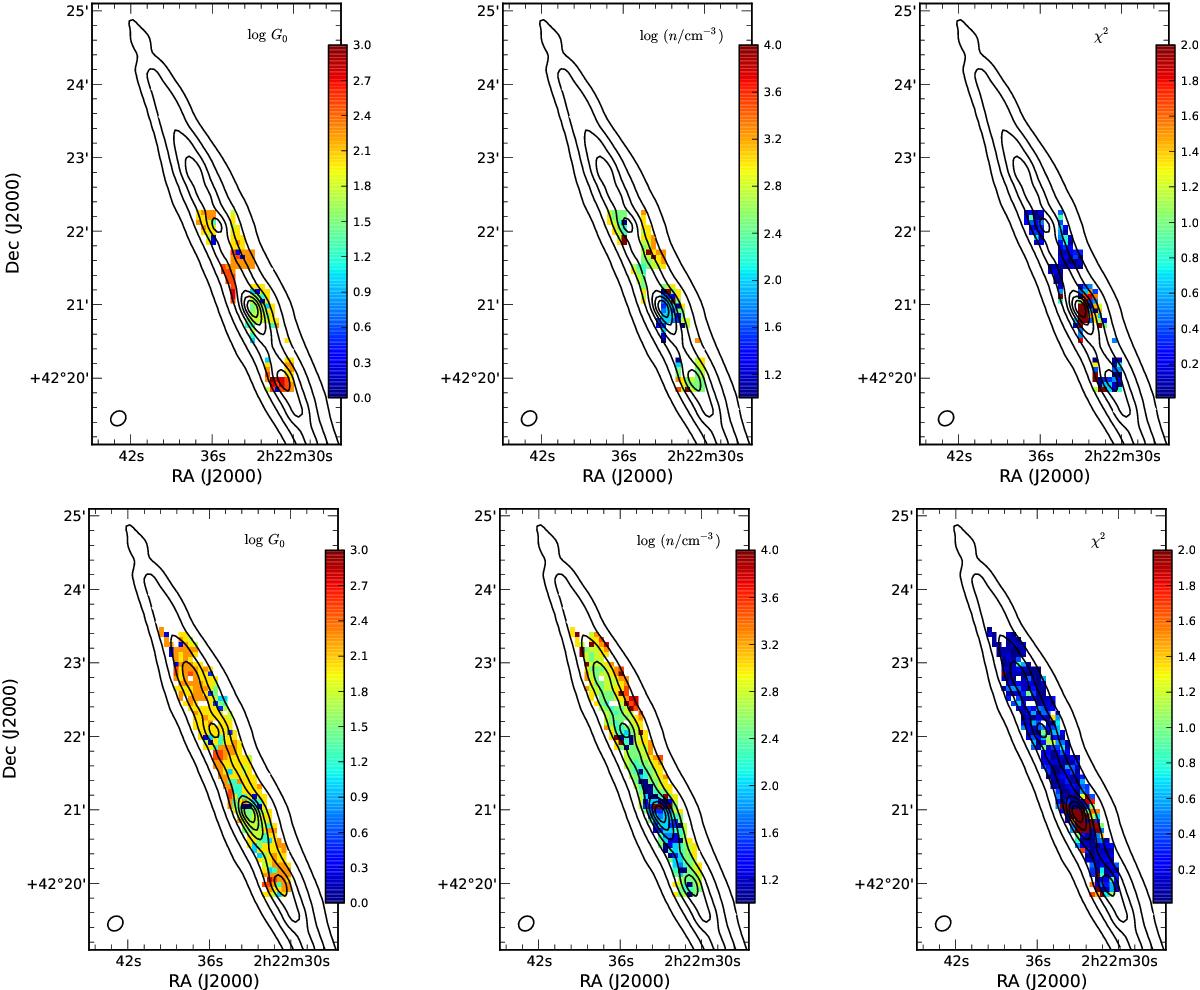
Maps of FUV radiation field strength, G0 (left),
hydrogen nuclei density, n (middle), and
χ2 (right)
determined from fitting the adjusted [Cii], [Oi]63, and
FTIR emission with the Kaufman et al. (1999, 2006) PDR model on a pixel-by-pixel basis. We compare the results
from the observations adjusted via the ![]() -based (upper
panels) and
-based (upper
panels) and ![]() -based corrections (lower
panels) described in Sect. 3.5. The
maps are centred on
-based corrections (lower
panels) described in Sect. 3.5. The
maps are centred on ![]() ,
,
![]() (J2000.0) and are presented in
the resolution and pixel size of the PACS 160 μm map. Contours from
the FTIR map (see Fig. 1) are superimposed on each image as a visual aid
with levels as listed in Fig. 4. North is up,
east is to the left.
(J2000.0) and are presented in
the resolution and pixel size of the PACS 160 μm map. Contours from
the FTIR map (see Fig. 1) are superimposed on each image as a visual aid
with levels as listed in Fig. 4. North is up,
east is to the left.
Current usage metrics show cumulative count of Article Views (full-text article views including HTML views, PDF and ePub downloads, according to the available data) and Abstracts Views on Vision4Press platform.
Data correspond to usage on the plateform after 2015. The current usage metrics is available 48-96 hours after online publication and is updated daily on week days.
Initial download of the metrics may take a while.