Fig. 12
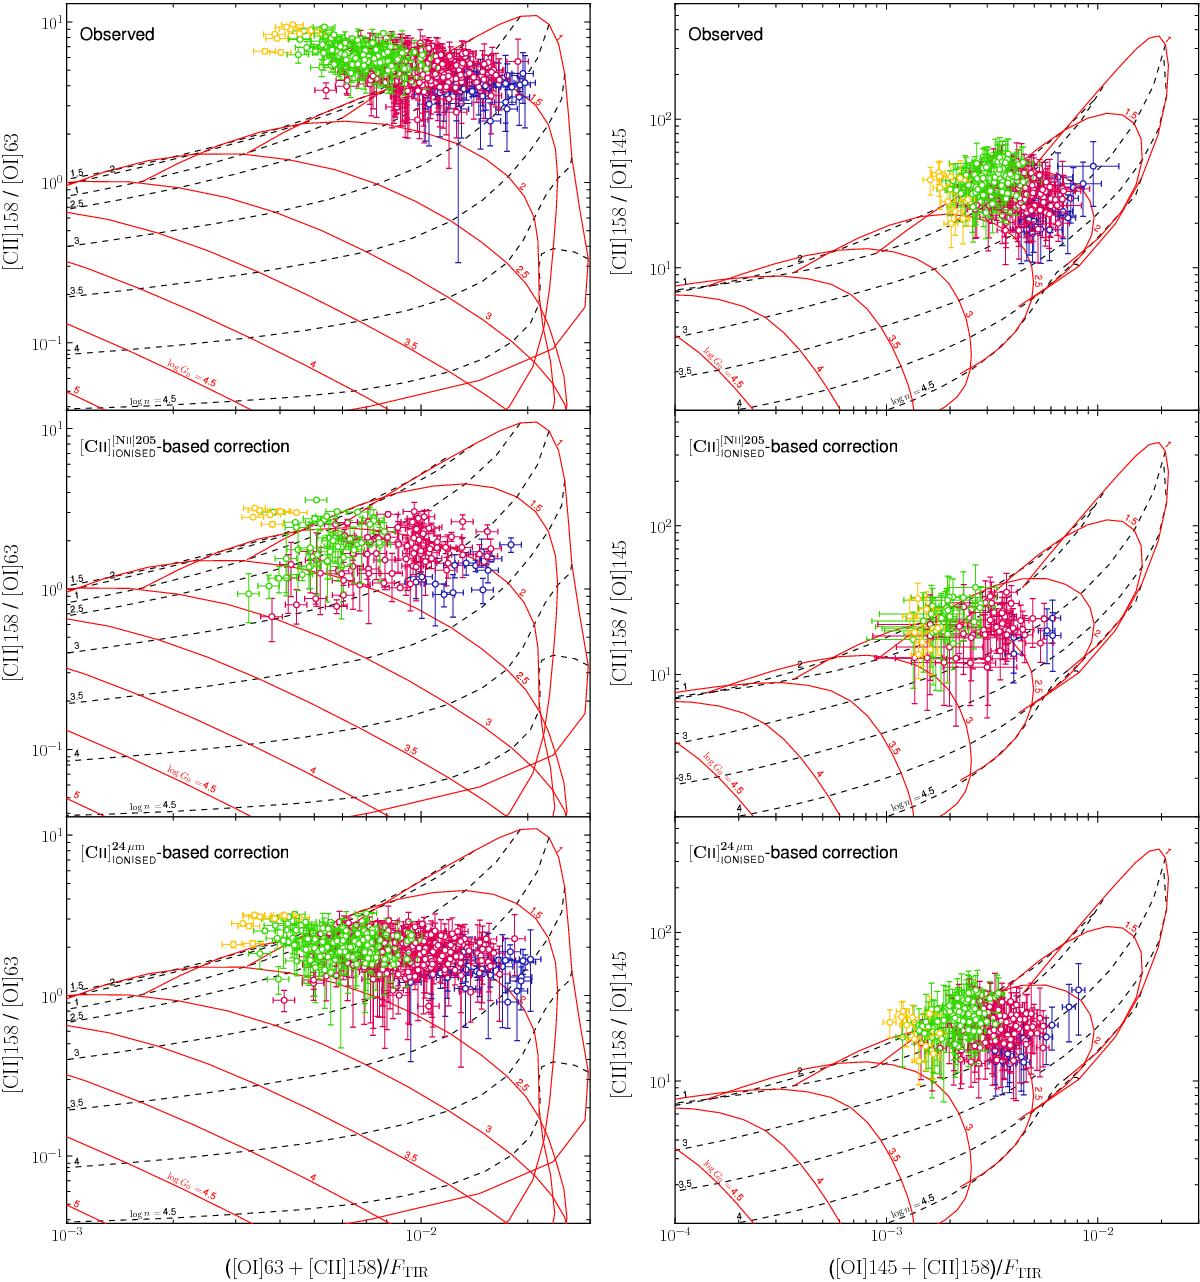
Diagnostic diagrams of the [Cii]/[Oi]63 ratio plotted against the ([Cii]+[Oi]63)/FTIR ratio (left panels) and the [Cii]/[Oi]145 versus ([Cii]+[Oi]145)/FTIR ratio (right panels) for NGC 891. We superimpose our adjusted observations onto a grid of constant hydrogen nuclei density, log n (black dashed lines), and FUV radiation field strength, log G0 (red solid lines), determined from the Kaufman et al. (1999, 2006) PDR model. Each data point represents one pixel, with colours as described in Fig. 11. We present our unadjusted observations (upper panels) and the observations including the adjustments applied to the [Cii], [Oi] 63 and FTIR emission as described in Sect. 4.1. We compare our two approaches to estimate (and remove) the fraction of the [Cii] emission arising from ionised gas, whereby one method uses the reliable measurements of the [Nii] 205 μm line emission (middle panels) and the alternative method uses the 24 μm emission as a proxy for the [Nii] 205 μm line emission (lower panels) via the correlation presented in Fig. 8. Error bars do not account for the uncertainties in these corrections to the [Cii] emission.
Current usage metrics show cumulative count of Article Views (full-text article views including HTML views, PDF and ePub downloads, according to the available data) and Abstracts Views on Vision4Press platform.
Data correspond to usage on the plateform after 2015. The current usage metrics is available 48-96 hours after online publication and is updated daily on week days.
Initial download of the metrics may take a while.