Fig. 11
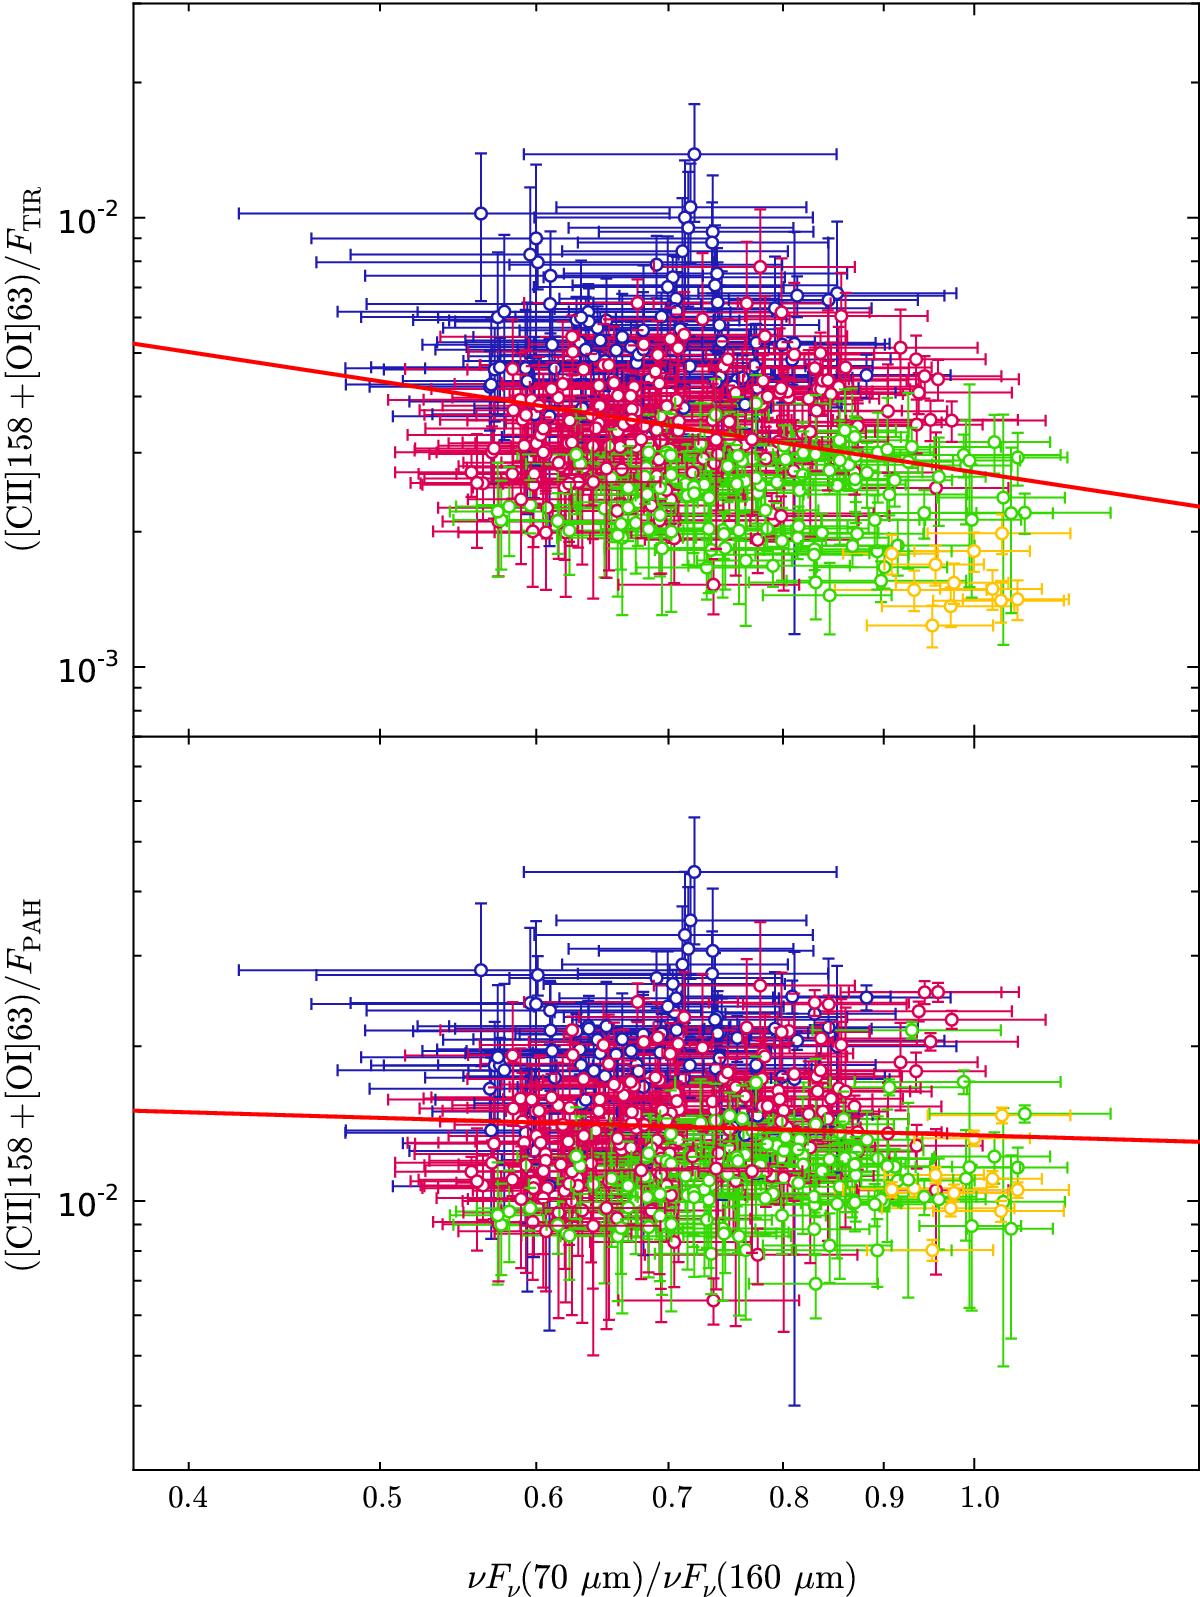
Comparison of the ([Cii]+[Oi]63)/FTIR and ([Cii]+[Oi]63)/ FPAH as a function of the νFν(70 μm) /νFν(160 μm) FIR colour. The [Cii] emission has been corrected to remove the contribution originating from the ionised gas (see Sect. 3.5). Each point represents a pixel, where pixels are coloured as depicted in Fig. 2, according to their location in either the nucleus (yellow), mid-plane (green), or at increasing radial distances across in the disc (red to blue). The red solid lines represent the best linear fits to the data.
Current usage metrics show cumulative count of Article Views (full-text article views including HTML views, PDF and ePub downloads, according to the available data) and Abstracts Views on Vision4Press platform.
Data correspond to usage on the plateform after 2015. The current usage metrics is available 48-96 hours after online publication and is updated daily on week days.
Initial download of the metrics may take a while.