Fig. 10
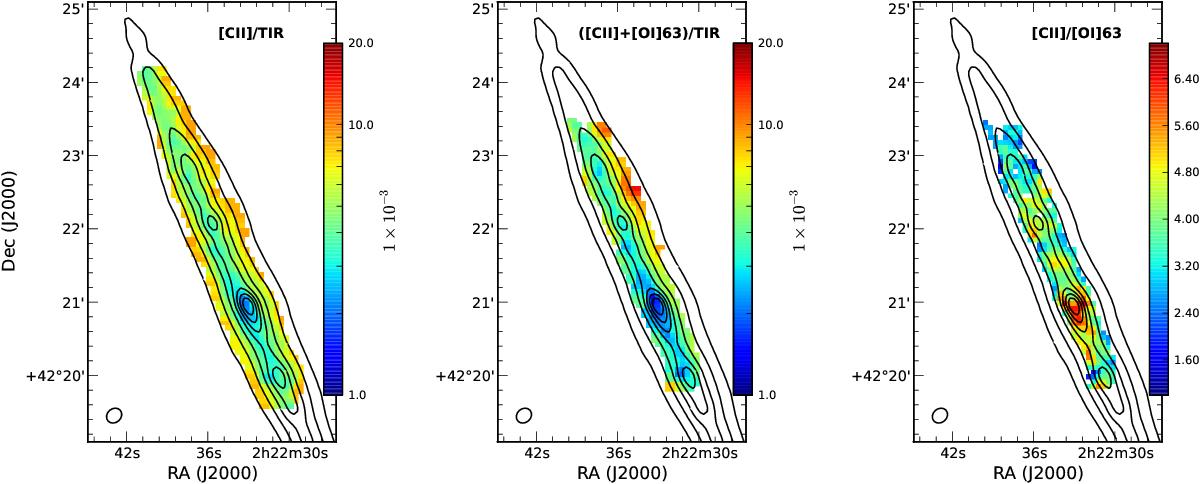
Maps of the main indicators of the gas heating and cooling: the uncorrected
[Cii] emission divided by the total infrared flux,
[Cii]/FTIR (left), the
sum of the [Cii] emission, corrected for the contribution
from ionised gas, and [Oi] 63 emission divided by the total infrared flux,
([Cii]+[Oi]63)/FTIR (middle),
and the [Cii]/[Oi]63 ratio, where the [Cii] emission is
also just the component from neutral gas (right). The maps are
centred on ![]() ,
,
![]() (J2000.0) and are presented in
the resolution and pixel size of the PACS 160 μm map. Contours from
the FTIR map (see Fig. 1) are superimposed on each image as a visual aid
with levels as listed in Fig. 4.
(J2000.0) and are presented in
the resolution and pixel size of the PACS 160 μm map. Contours from
the FTIR map (see Fig. 1) are superimposed on each image as a visual aid
with levels as listed in Fig. 4.
Current usage metrics show cumulative count of Article Views (full-text article views including HTML views, PDF and ePub downloads, according to the available data) and Abstracts Views on Vision4Press platform.
Data correspond to usage on the plateform after 2015. The current usage metrics is available 48-96 hours after online publication and is updated daily on week days.
Initial download of the metrics may take a while.