Fig. 1
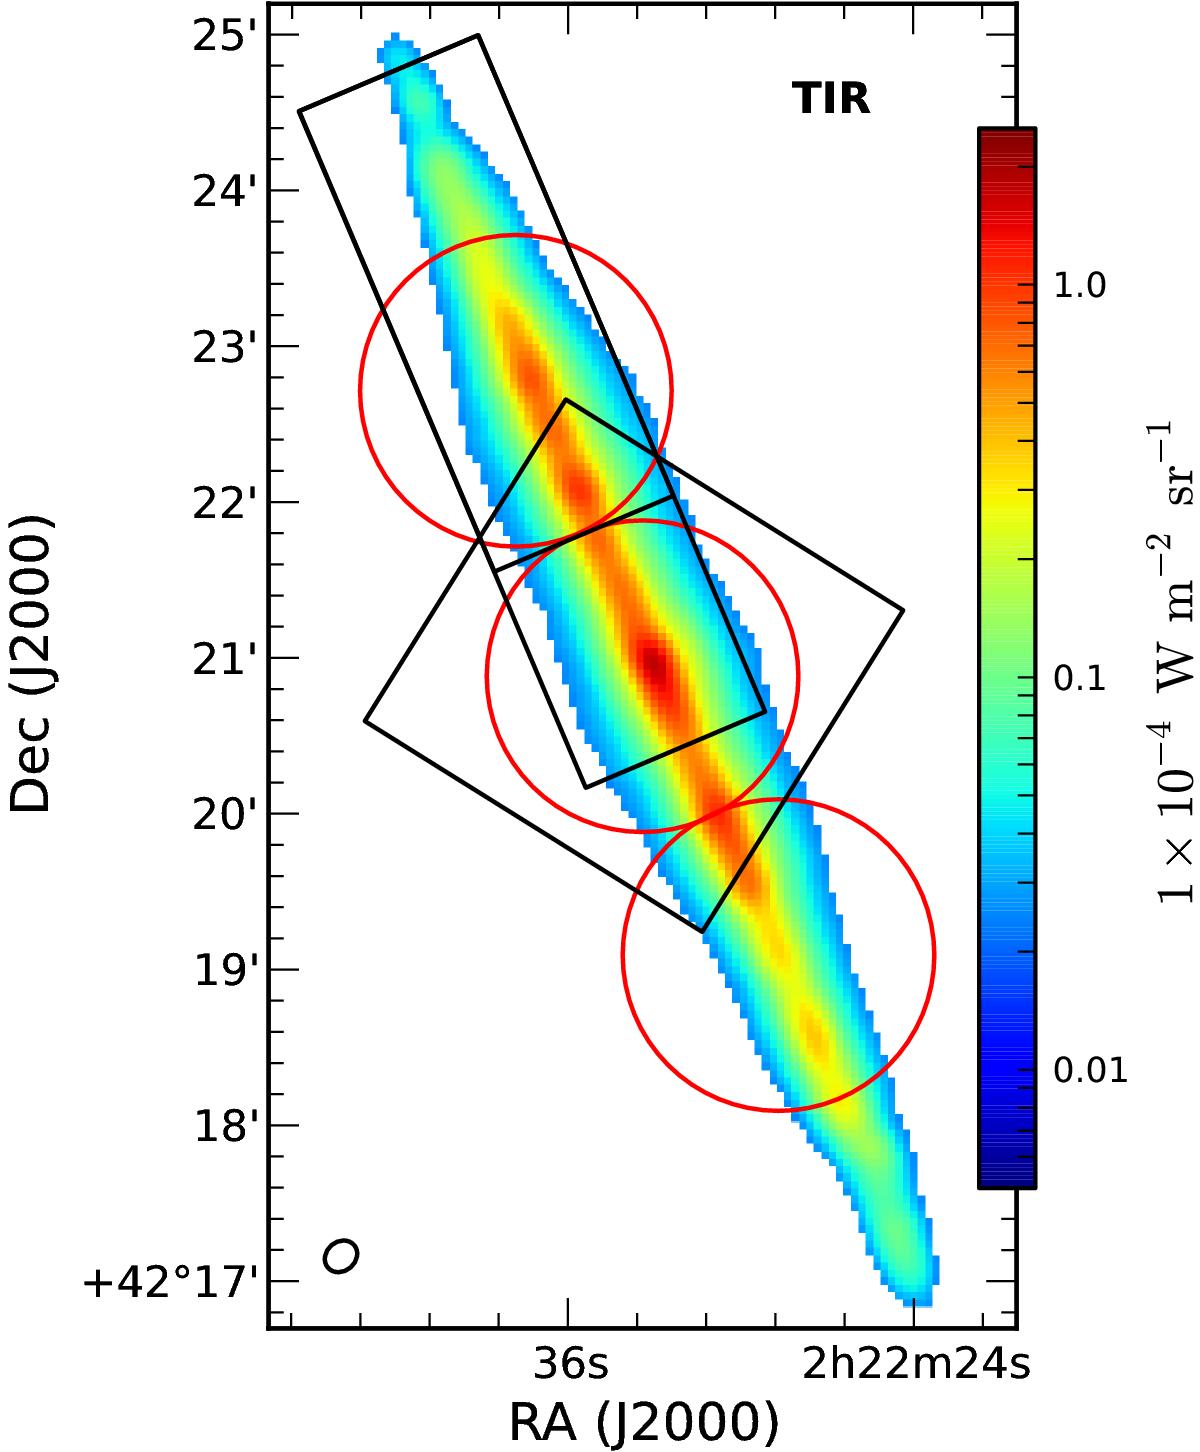
Total infrared flux, FTIR, derived from the MIPS 24 μm, PACS 70 and 160 μm maps using Eq. (1). The map is presented in the 12″ resolution of the PACS 160 μm image with a pixel scale of 4″ and units of W m-2 sr-1. The black square, black rectangle and red circles demarcate the coverage of the PACS spectroscopic maps, PACS strips, and the SPIRE FTS observations, respectively. North is up, east is to the left.
Current usage metrics show cumulative count of Article Views (full-text article views including HTML views, PDF and ePub downloads, according to the available data) and Abstracts Views on Vision4Press platform.
Data correspond to usage on the plateform after 2015. The current usage metrics is available 48-96 hours after online publication and is updated daily on week days.
Initial download of the metrics may take a while.