Fig. 7
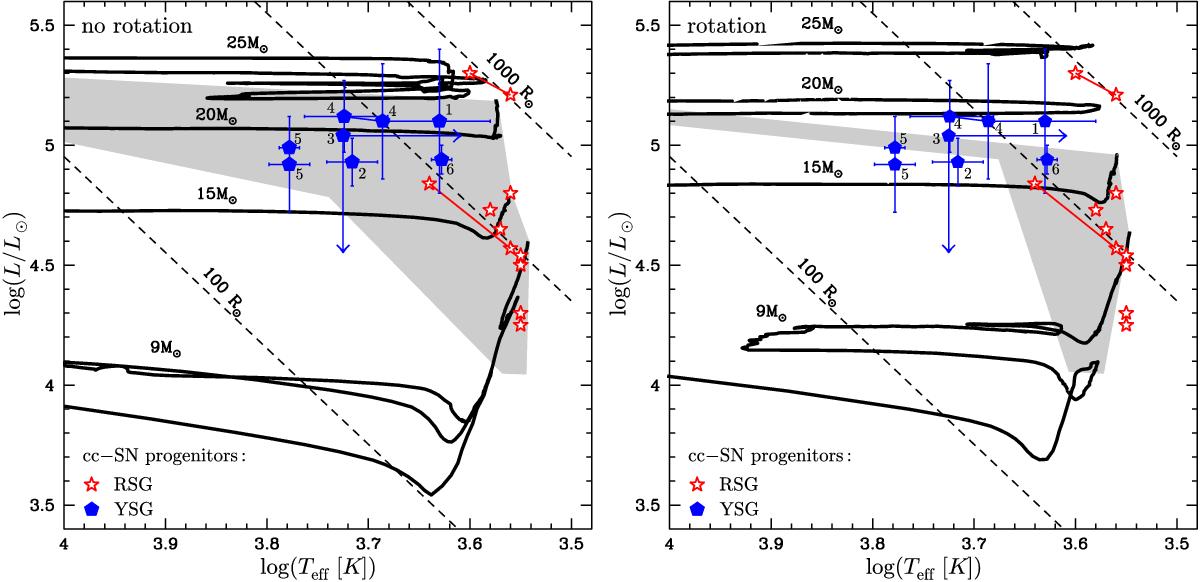
Left panel: evolutionary tracks in the HRD for the nonrotating models computed with the standard mass-loss rates, superposed the positions of progenitors of core-collapse supernovae. Empty stars indicate RSGs (see Table 2), filled pentagons those with a yellow supergiant as progenitors (see Table 6). A continuous segment links the positions of the same SN progenitors obtained by various authors. Progenitors of supernovae predicted by the nonrotating models computed with the various RSG mass-loss rates are found in the shaded area. Progenitors obtained with standard RSG mass-loss rates occupy the upper part as well as the right part of the shaded region, while the progenitors obtained from enhanced RSG mass-loss rate models are in the lower-left region of the shaded area. Lines of constant radius are indicated, the line intermediate between the 100 and 1000 R⊙ corresponds to a radius of 500 R⊙. Right panel: same as left panel with evolutionary tracks in the HRD for the rotating models computed with the standard mass-loss rates. Progenitors of supernovae predicted by the rotating models computed with the various RSG mass-loss rates are found in the shaded area.
Current usage metrics show cumulative count of Article Views (full-text article views including HTML views, PDF and ePub downloads, according to the available data) and Abstracts Views on Vision4Press platform.
Data correspond to usage on the plateform after 2015. The current usage metrics is available 48-96 hours after online publication and is updated daily on week days.
Initial download of the metrics may take a while.