Fig. 5
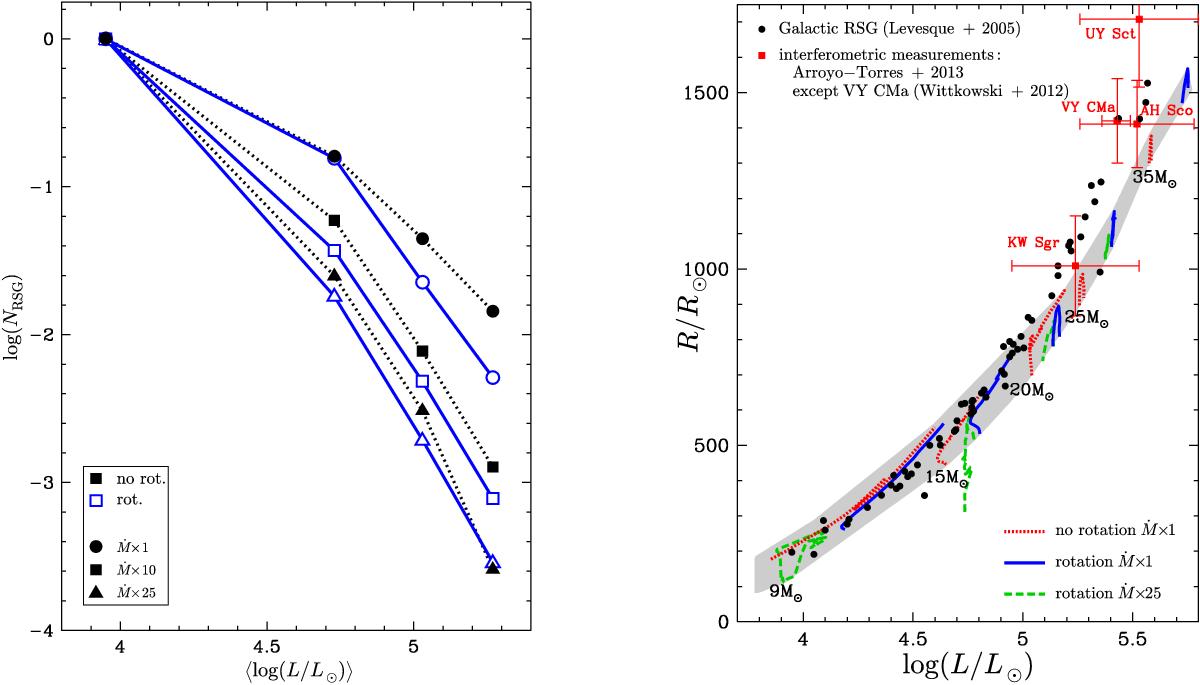
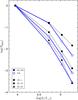
Left panel: number of RSGs as a function of luminosity in a region with constant star formation rate (see text). Numbers are normalized to the model with 9 M⊙. Dots indicate the values obtained for the models with 9, 15, 20, and 25 M⊙ from left to right. Right panel: radii of various stellar models during the RSG phase (Log Teff< 3.6) as a function of the luminosity. The shaded area indicates the region covered by the models with different initial masses, rotations, and mass-loss rates. The 25 times enhanced, rotating 15 M⊙ is the only model that evolves out of this region. The initial mass is indicated at the lowest luminosity predicted by the models for this mass.
Current usage metrics show cumulative count of Article Views (full-text article views including HTML views, PDF and ePub downloads, according to the available data) and Abstracts Views on Vision4Press platform.
Data correspond to usage on the plateform after 2015. The current usage metrics is available 48-96 hours after online publication and is updated daily on week days.
Initial download of the metrics may take a while.