Fig. 2
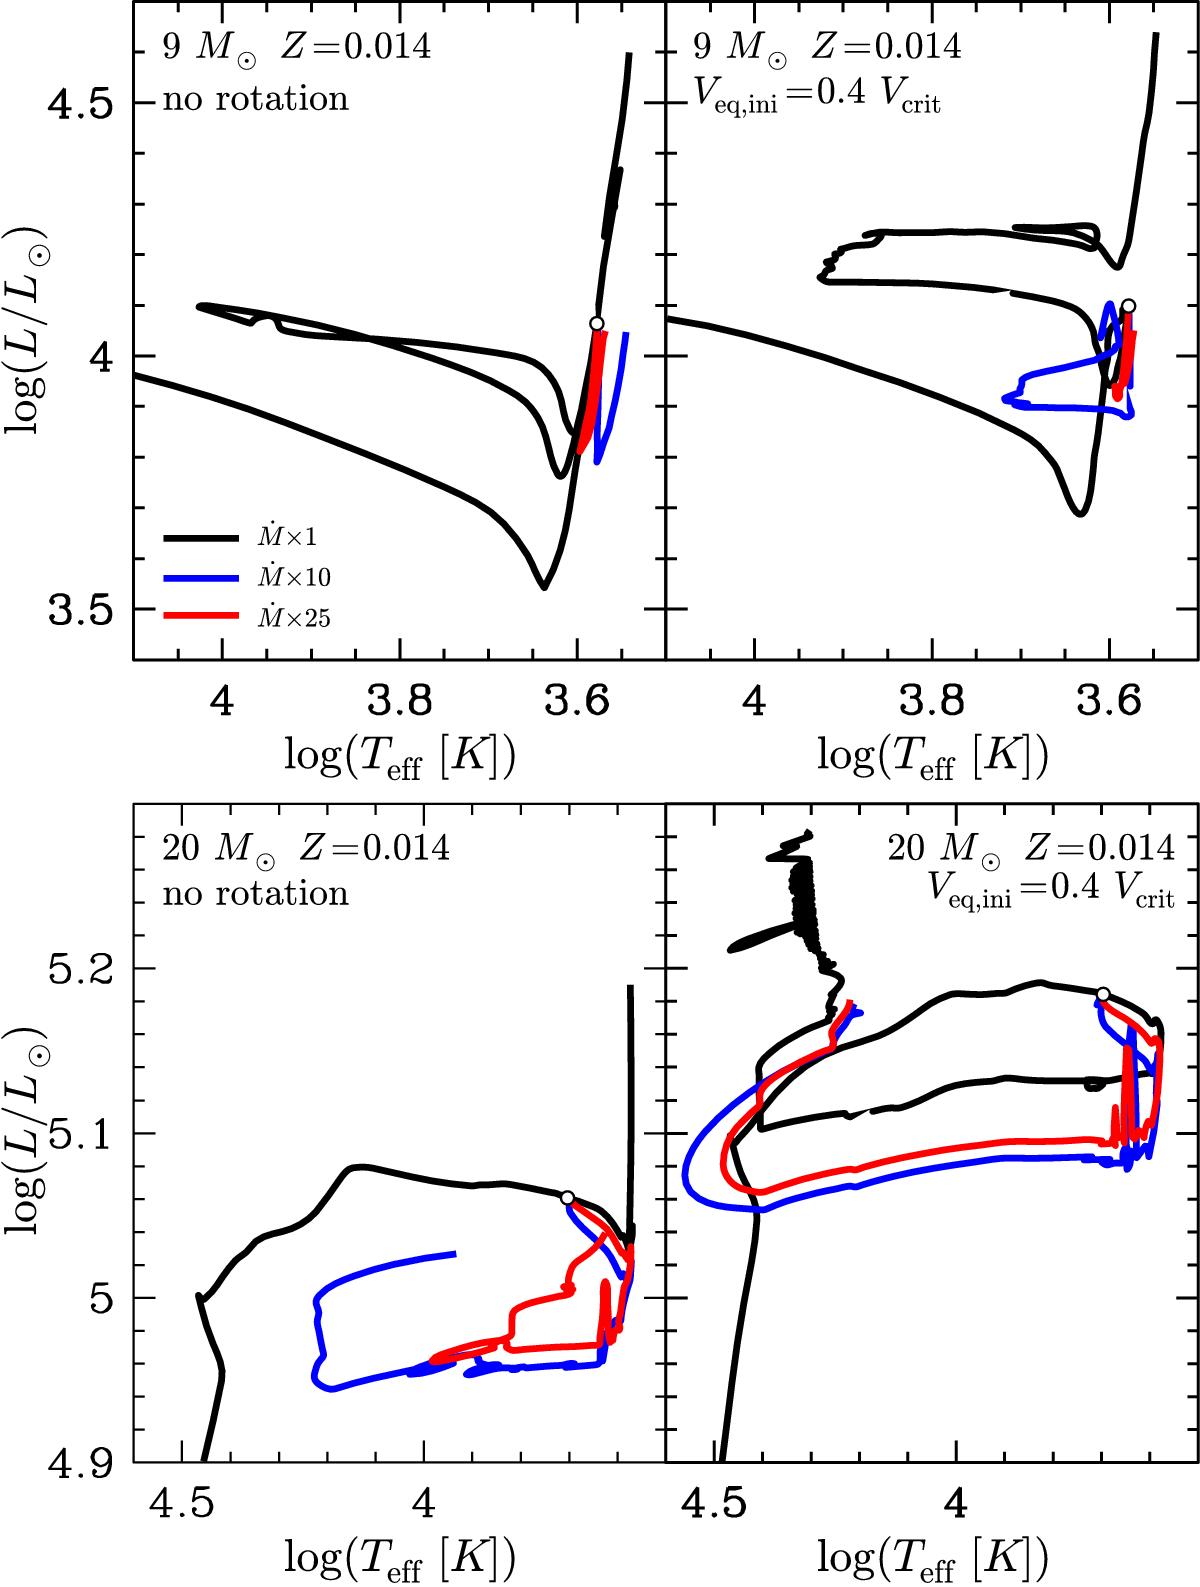
Evolutionary tracks for stellar models of 9 and 20 M⊙ for various prescriptions of the RSG mass-loss rates. Only partial tracks are shown. In the upper panel, the lowest line shows the first crossing from blue to red of the HR gap. The beginning of the portion of the track computed with an enhanced RSG mass-loss rate is indicated by a small empty circle.
Current usage metrics show cumulative count of Article Views (full-text article views including HTML views, PDF and ePub downloads, according to the available data) and Abstracts Views on Vision4Press platform.
Data correspond to usage on the plateform after 2015. The current usage metrics is available 48-96 hours after online publication and is updated daily on week days.
Initial download of the metrics may take a while.