Fig. 1
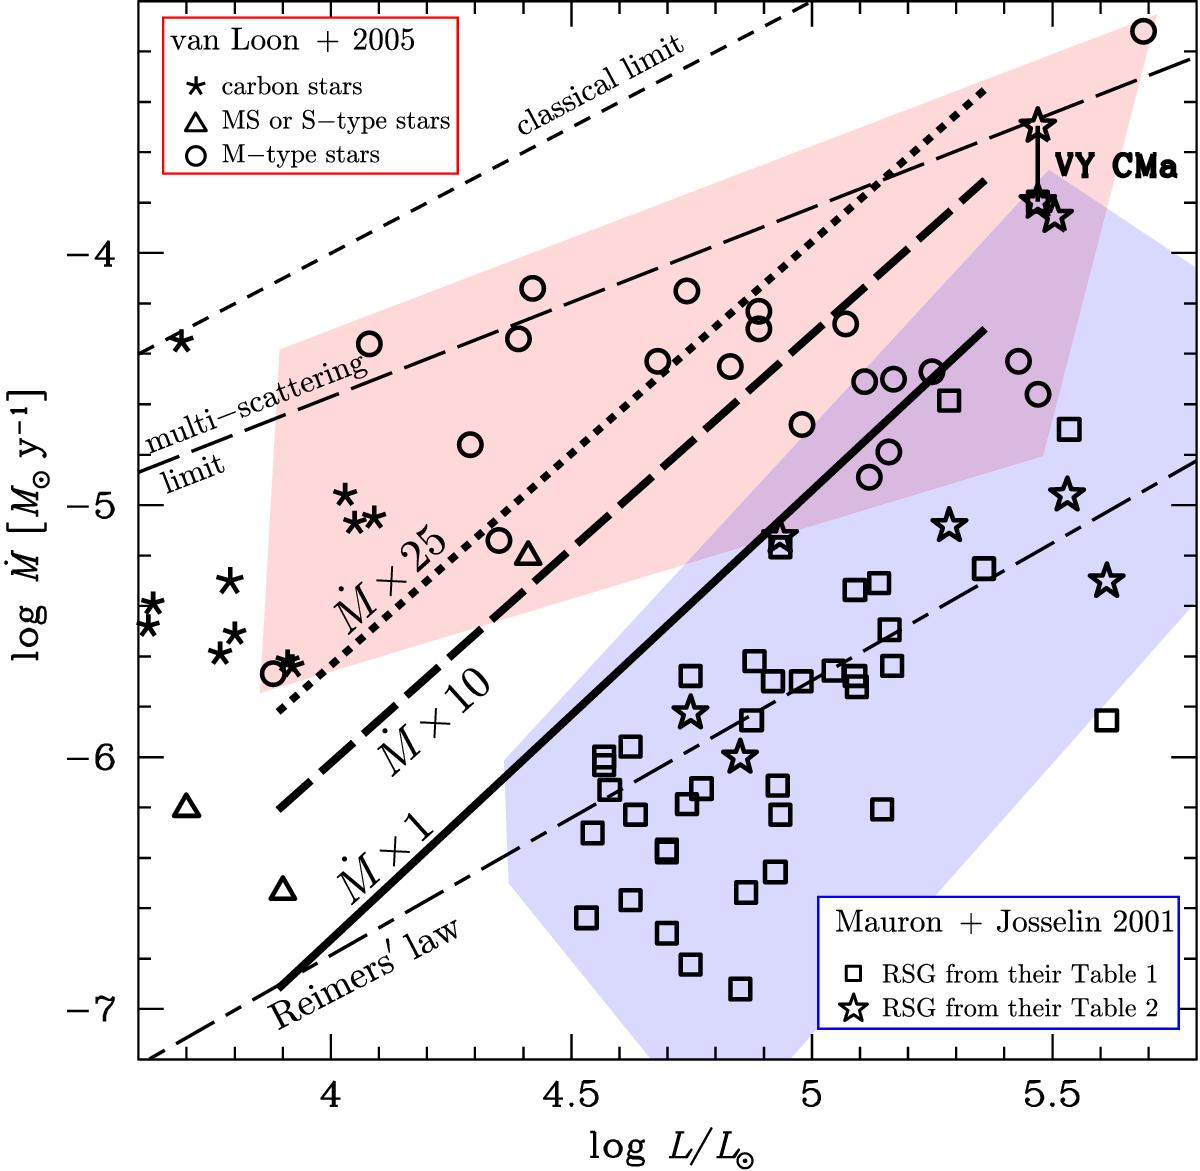
Comparison between the mass-loss rates deduced from spectroscopy by different authors and the average values used in our models during the RSG phase. The data by van Loon et al. (2005) cover the region shaded in red. The data by Mauron & Josselin (2011) are distributed in the region shaded in blue. The two stars linked by a vertical line show the mass-loss rates for VY CMa; the lower value is taken from Table 1 of Mauron & Josselin (2011), the upper value from Matsuura et al. (2014). The heavy continuous, long-dashed and dotted lines are our averaged RSG mass-loss rates equal to 1, 10, and 25 times the standard mass-loss rate (see text). The upper thin long and short-dashed slanted lines mark the classical and multiple-scattering limits to the mass-loss rate (van Loon et al. 1999). The lower thin short-long-dashed line shows the Reimers law for an average temperature Teff = 3750 K (see Mauron & Josselin 2011).
Current usage metrics show cumulative count of Article Views (full-text article views including HTML views, PDF and ePub downloads, according to the available data) and Abstracts Views on Vision4Press platform.
Data correspond to usage on the plateform after 2015. The current usage metrics is available 48-96 hours after online publication and is updated daily on week days.
Initial download of the metrics may take a while.