Fig. 2
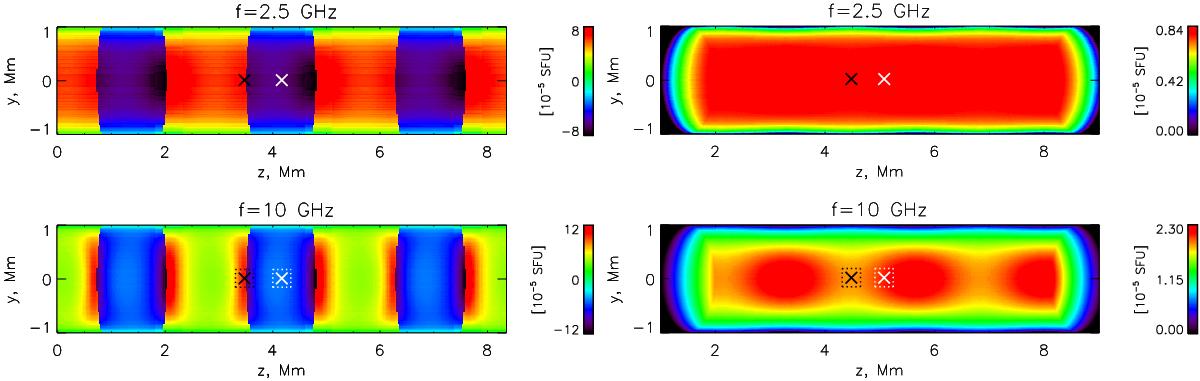
Polarization (Stokes V) of the radiation from the loop observed at angles of (left column) 90° and (right column) 60° at frequencies 2.5 GHz and 10 GHz. Snapshots are taken at t = 3P/ 4 for the base model. Left and right crosses denote the location of an antinode and node, respectively. A pixel of size 0.5′′ (dotted line) is shown in the bottom panels.
Current usage metrics show cumulative count of Article Views (full-text article views including HTML views, PDF and ePub downloads, according to the available data) and Abstracts Views on Vision4Press platform.
Data correspond to usage on the plateform after 2015. The current usage metrics is available 48-96 hours after online publication and is updated daily on week days.
Initial download of the metrics may take a while.