Fig. 10
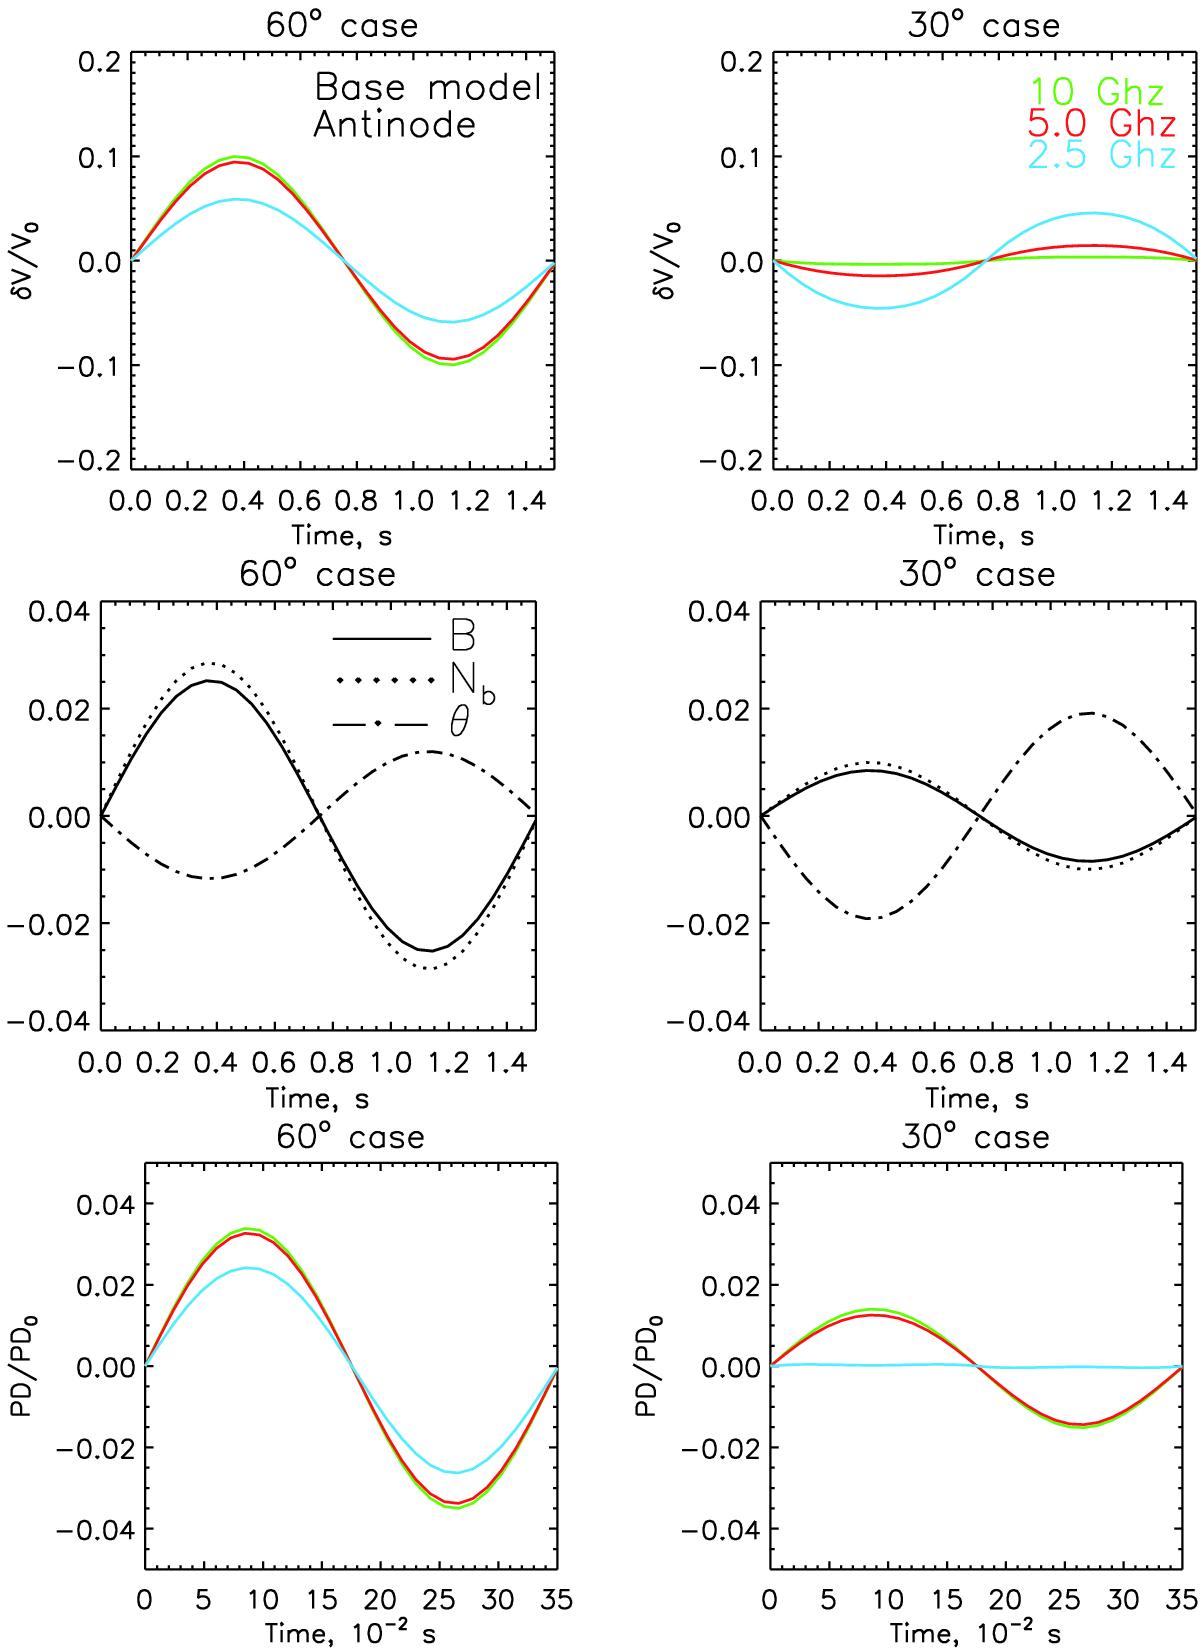
Temporal variation of the normalized polarization (top row) and polarization degree (bottom row) from a pixel of 0.5′′ centered on an antinode in the base model. The color coding of different frequencies is denoted in the top-right plot. The relative perturbations of the magnetic field, density, and B-LOS angle averaged along the LOS (second row) are shown by solid, dotted, and dashed-dotted curves, respectively.
Current usage metrics show cumulative count of Article Views (full-text article views including HTML views, PDF and ePub downloads, according to the available data) and Abstracts Views on Vision4Press platform.
Data correspond to usage on the plateform after 2015. The current usage metrics is available 48-96 hours after online publication and is updated daily on week days.
Initial download of the metrics may take a while.