Fig. 7
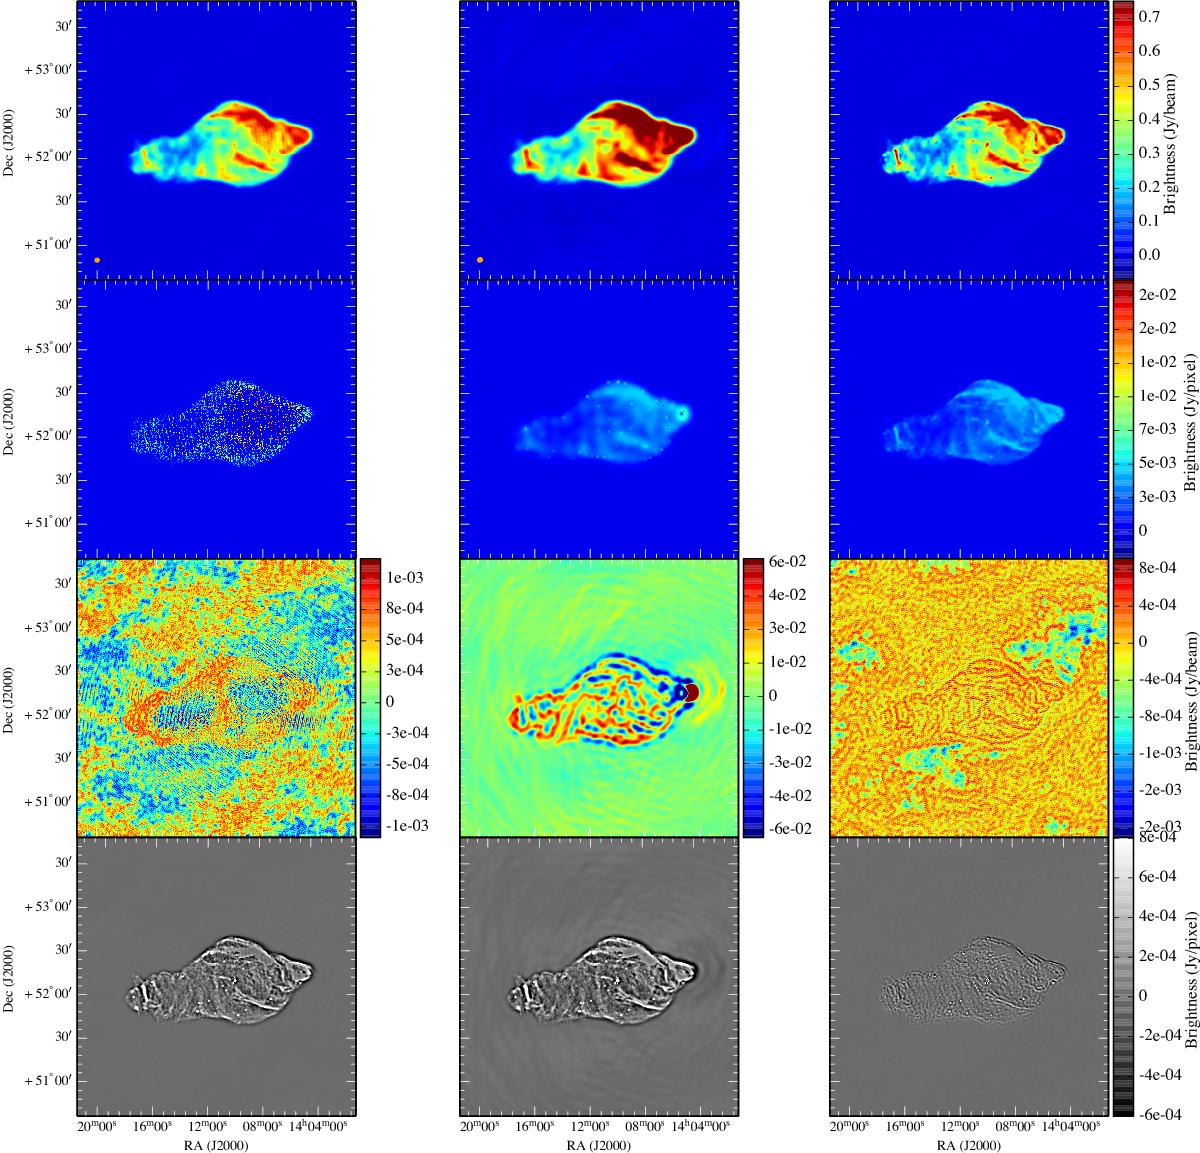
Reconstructed images of W50 from the simulated LOFAR observation (dataset B) using CoSch-CLEAN (left column), MS-CLEAN (middle column), and CS (right column). From top to bottom: the restored (in Jy/beam), the model (in Jy/pixel), the residual, and the error images. The CS restored and model images only differ by their scaling (the former is in Jy/beam using the beam area of the CoSch-CLEAN beam, the latter is in Jy/pixel). The colour scales of the images are different for each row, as indicated by the colour bar on the right. The residual images are displayed with their respective colour bar. The CS reconstruction contains high spatial frequency information restored from the dataset. The effective angular resolution of the CS image (1′) is close to that of the original input image (55′′). In addition, the error image shows a closer proximity between CS and the original input image.
Current usage metrics show cumulative count of Article Views (full-text article views including HTML views, PDF and ePub downloads, according to the available data) and Abstracts Views on Vision4Press platform.
Data correspond to usage on the plateform after 2015. The current usage metrics is available 48-96 hours after online publication and is updated daily on week days.
Initial download of the metrics may take a while.