Fig. 5
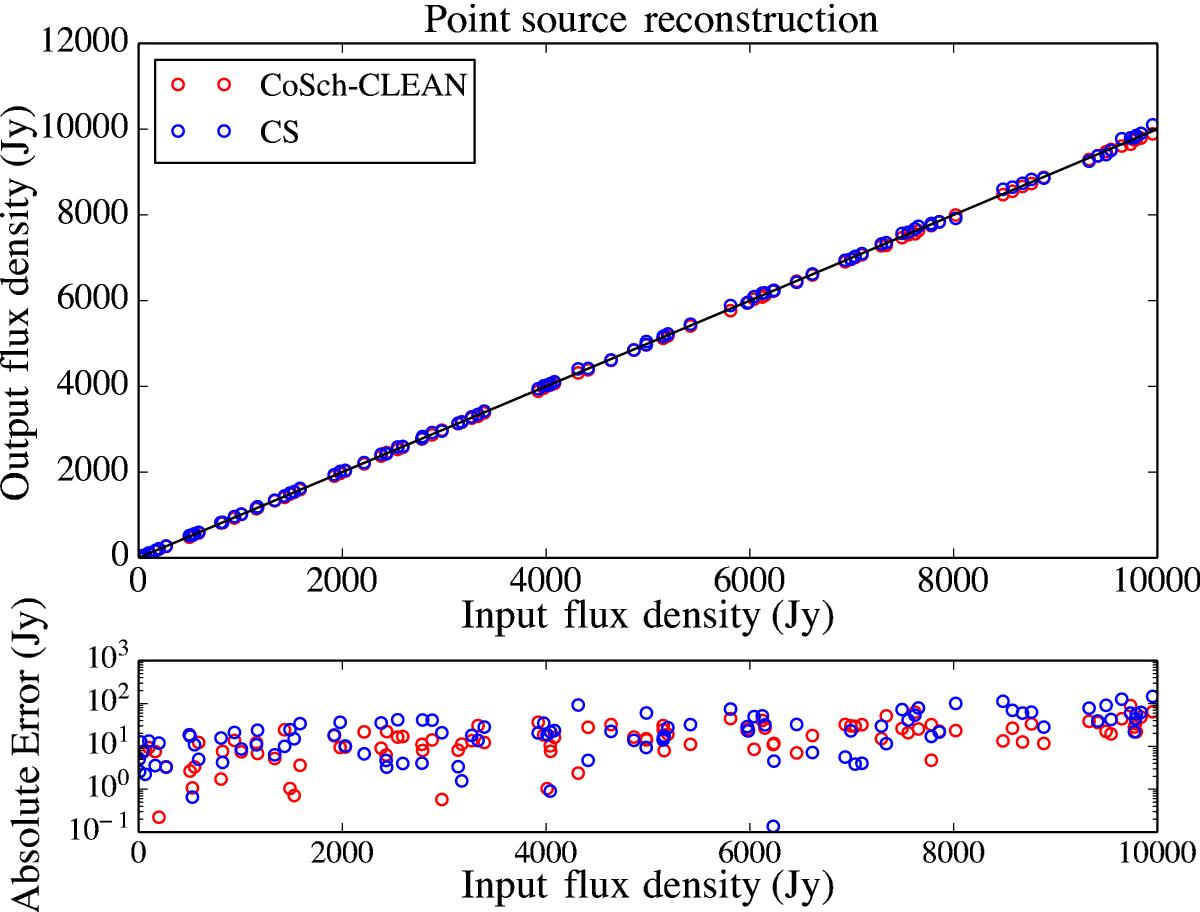
Top: total flux density reconstruction for a set of point sources (Fig. 4) with original flux density spanning over 4 orders of magnitude with the original flux density (x-axis) vs. the recovered flux density (y-axis). Bottom: scatter plot of the absolute the error for each source. The recovered flux densities for CoSch-CLEAN (red) and CS (blue) are represented on a linear scale, whereas the absolute error is on a logarithmic scale for clarity. Perfect reconstruction lies along the black line. The output flux density values and errors are similar with both CoSch-CLEAN and CS.
Current usage metrics show cumulative count of Article Views (full-text article views including HTML views, PDF and ePub downloads, according to the available data) and Abstracts Views on Vision4Press platform.
Data correspond to usage on the plateform after 2015. The current usage metrics is available 48-96 hours after online publication and is updated daily on week days.
Initial download of the metrics may take a while.