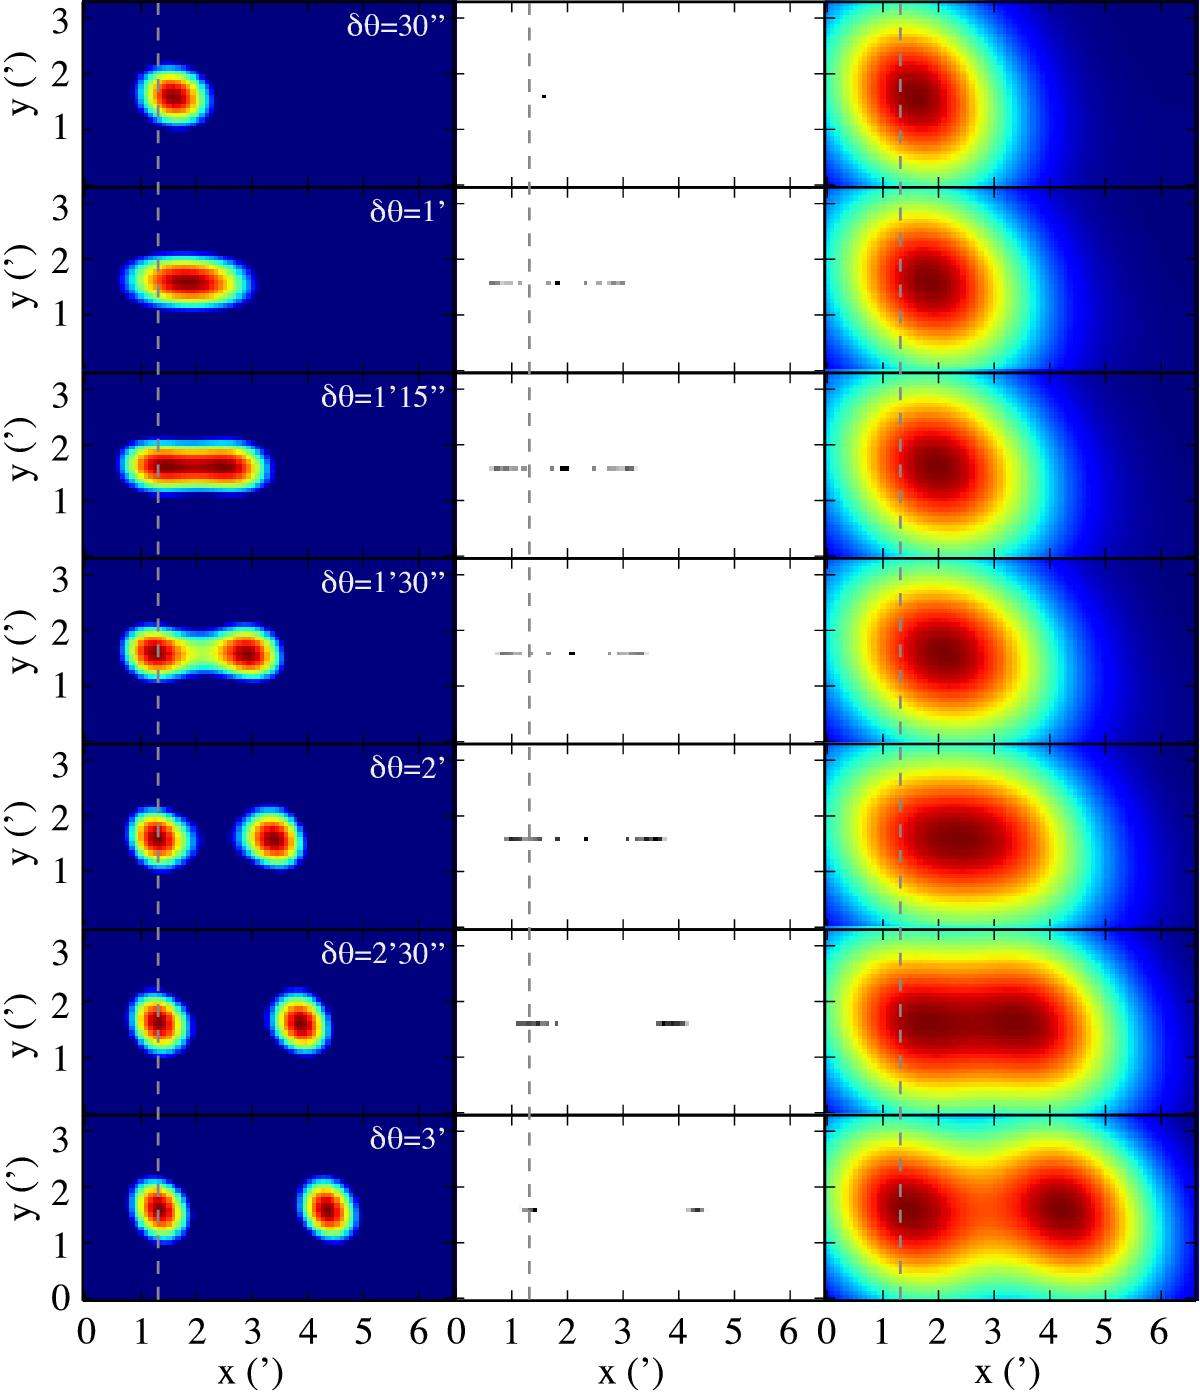
Fig. 2

Resulting reconstructed CS image (left column), CoSch-CLEAN model (middle column), and convolved (right column) images obtained from a simulation of two point sources with different angular separation δθ from 30′′ to 3′ by steps of 30′′ (from top to bottom) plus the δθ = 1′15′′ case. The third column was obtained by convolving the CLEAN components (middle column) with the CLEAN beam of FWHM 3.18′ × 2.55′. The effective separation of the two sources, after imaging by the different methods, occurs at smaller angular separation with CS (between δθ = 1′ and δθ = 1′15′′) than with CoSch-CLEAN (between δθ = 2′ and δθ = 2′30′′). The unambiguous separation of the two sources was obtained within few pixel errors, starting from δθ = 1′30′′ for CS and δθ = 3′ for CoSch-CLEAN. Each cropped image was originally of size 512 × 512 pixels of 5′′. The (u,v) coverage has been restricted to the [0.1 kλ,1.6 kλ] domain to enforce an artificial resolution of ~2′. The colour map scales are normalized to the maximum of each image, but colour bars were not represented for clarity. The contrast of the CLEAN components (middle column) was enhanced to ease their visibility. The grey vertical dash line marks the true position of the source located at the phase centre of the dataset.
Current usage metrics show cumulative count of Article Views (full-text article views including HTML views, PDF and ePub downloads, according to the available data) and Abstracts Views on Vision4Press platform.
Data correspond to usage on the plateform after 2015. The current usage metrics is available 48-96 hours after online publication and is updated daily on week days.
Initial download of the metrics may take a while.


