Fig. 1
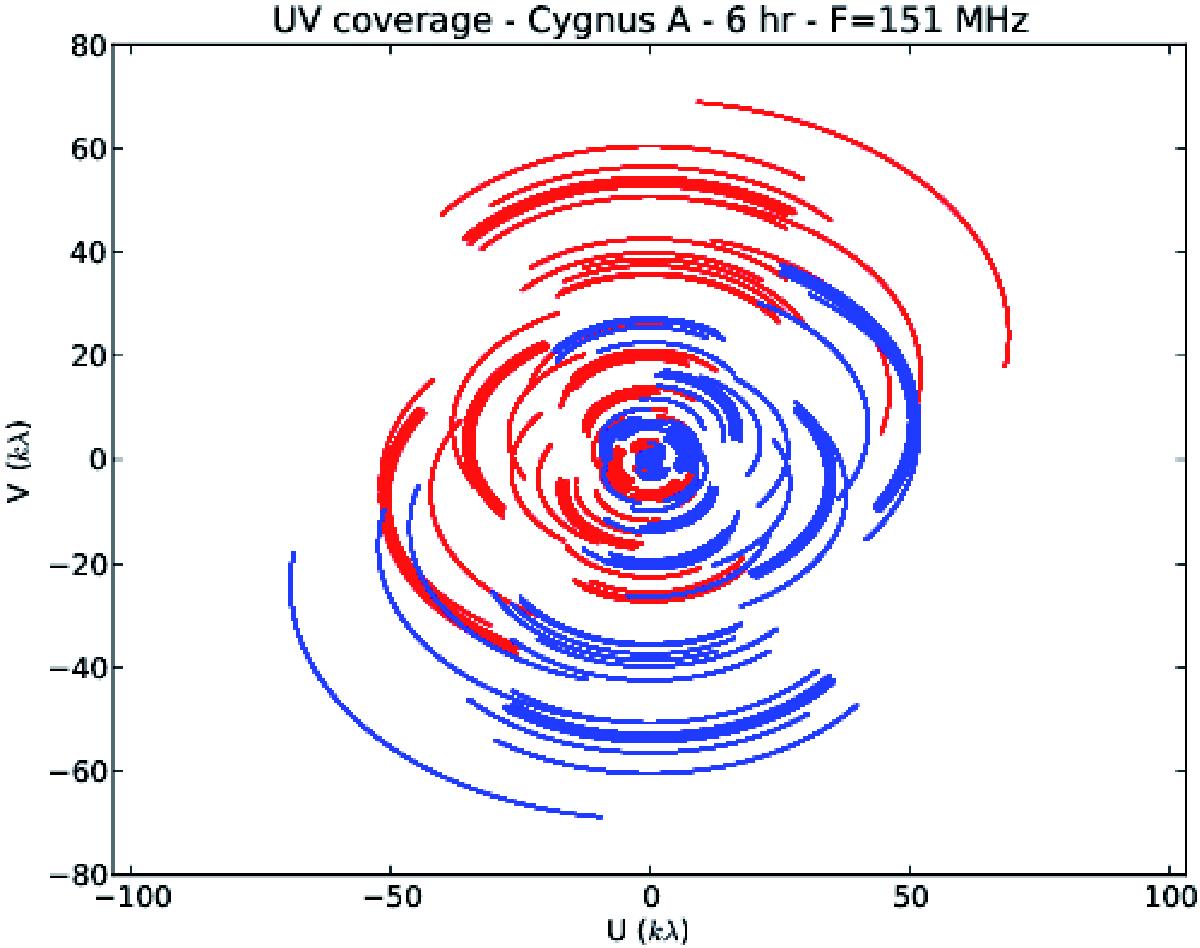
Visibility coverage from a six-hour observation of Cygnus A (McKean et al. 2010). Visibilities are plotted in the Fourier space with the U (x-axis) and V (y-axis) being the spatial frequencies in wavelength unit, λ (here f = 151 MHz, λ ≈ 2 m) determined by the baseline projection on the sky. Each (u,v) point (red) has its symmetric (−u, − v) point (blue) corresponding to the same baseline. The lines indicate (u,v) points where a visibility was recorded. The arcs are built from varying the baseline projections with the rotation of Earth during the observation.
Current usage metrics show cumulative count of Article Views (full-text article views including HTML views, PDF and ePub downloads, according to the available data) and Abstracts Views on Vision4Press platform.
Data correspond to usage on the plateform after 2015. The current usage metrics is available 48-96 hours after online publication and is updated daily on week days.
Initial download of the metrics may take a while.